9.1% Inflation
Some Nuanced Thoughts on a Really Big Number
Thanks for reading! If you haven’t subscribed, please click the button below:
By subscribing you’ll join over 9,000 people who read Apricitas weekly!
Otherwise, liking or sharing is the best way to support my work. Thank you!
Sometimes a number is just so big, so stark that it sucks out all the air from the rest of the virtual room.
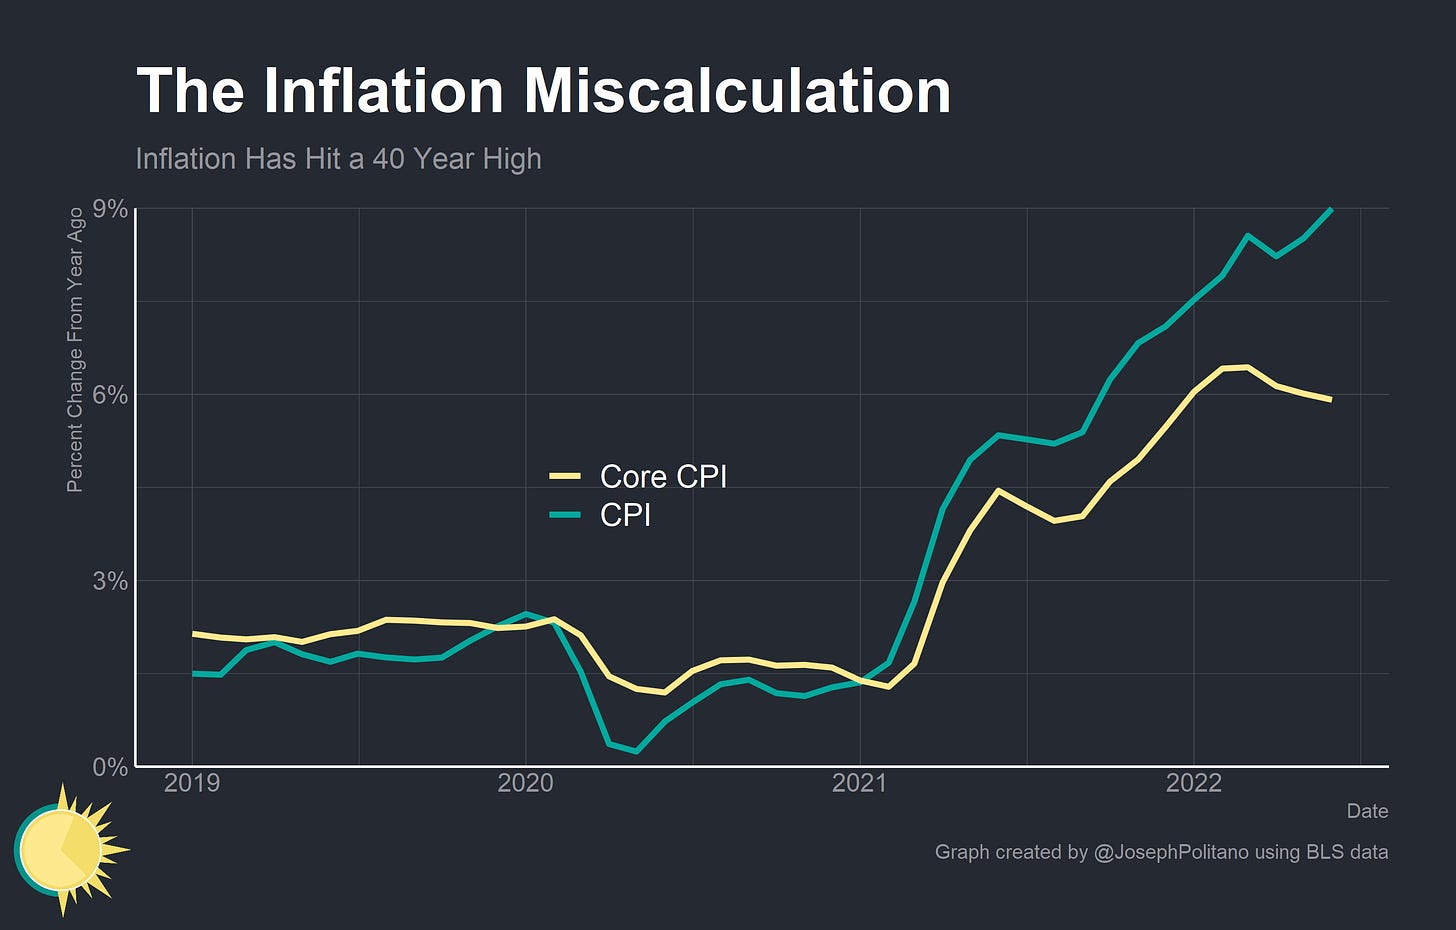
This week’s Consumer Price Index (CPI) showed inflation running at 9.1% as of June. That’s the highest annual rate in 40 years and—besides the time Hurricanes Katrina and Rita sent gas prices soaring in 2005—the highest monthly rate since 1980. Inflation breached a psychological barrier at 9%, exceeded its March peak, and has yet to meaningfully slow down.
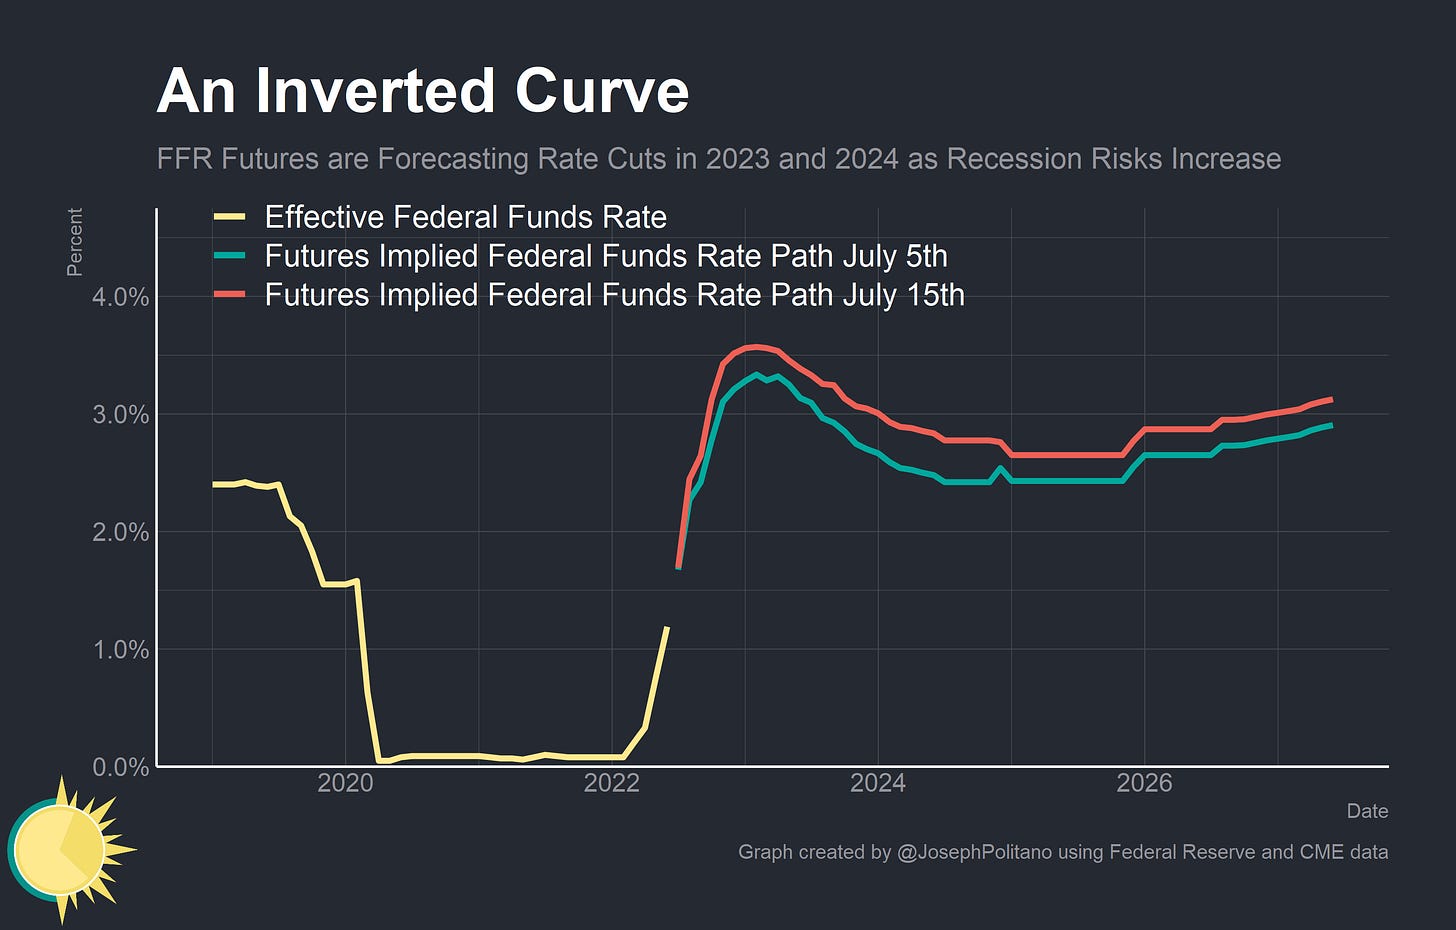
Digging nuance out of this is hard—prices are high, prices are rising, and almost every good or service you look at will show price acceleration over the prior year. The immediate market reaction to the CPI report was to price in near-certainty of a 1% interest rate hike at the Federal Reserve’s next meeting (though expectations softened significantly after a statement by the Fed’s Chris Waller the following day). In short, the specific disaggregations of inflation no longer matter much to Jerome Powell—prices are growing too fast for his liking and monetary policy must tighten to combat inflation regardless of its underlying dynamics.
Still, it’s worth dissecting this report—even if sector-by-sector dynamics don’t matter much for the stance of monetary policy, they still matter a great deal for the state of the economy and the future outlook for inflation. And at worst it can help us understand what’s made recent inflation prints such a scorcher.
Damage Report
Before the pandemic, the vast majority of America’s core inflation was concentrated in the service sector, with headline inflation being dragged around by fluctuations in the energy sector. In the early pandemic services prices—which are about 1/2 housing and 1/2 labor-intensive personal services—decelerated dramatically as consumers stayed at home and household formation collapsed. Energy costs sank as gas prices plunged, and only food prices accelerated as consumers attempted to stock up and shifted consumption from restaurants to grocery stores.
Throughout 2021, that story changed. At first, energy prices began to pick back up from their lows. Then core goods prices jumped as costs for new and used vehicles surged dramatically and homebound consumers flush with cash continued ordering more and more goods. Services prices started to drift back upward as wages increased, rental markets recovered, and consumers began going outside. Quickly, things started getting out of hand—goods prices continued to march upwards—as did services prices, energy costs, and food costs. The Russian invasion of Ukraine destabilized markets further—energy and food prices rose as critical exports from war-affected regions—especially natural gas exports to Europe—were reduced or shut off.
Today, approximately 3.2% of the 9.1% inflation comes from core services—with another 3% from energy, 1.5% from food, and 1.5% from core goods. Any one of those numbers would have been a black swan event before the pandemic; all of them together is nearly unprecedented. More difficult is that core services—the item that the Fed has the most control over—only represents 3% of current inflation. That’s too high by pre-pandemic standards, but still not enough to “solve” inflation if it alone is brought back to normal levels—the case for monetary policy getting inflation down requires disinflation or deflation in swathes of goods and services whose prices are usually less directly impacted by monetary policy.
Digging down to monthly levels makes the trend since early 2022 clearer—services prices are running hot—especially housing—but it is the rapid rises in energy costs (alongside less shocking jumps in food prices) that are truly pushing inflation higher. Gasoline prices sat at $3.20 in January—and peaked at $5.00 in early June. Henry Hub Natural Gas prices sat at $3.73 in January—and peaked at nearly $9.50 in early June. Energy commodities have fallen a bit since then, but the effects of the Russian invasion of Ukraine and preexisting energy imbalances remain pronounced.
Worse still, year-on-year core inflation is set to increase over the next few months, even if declining energy prices pull headline inflation down. This time last year saw the rapid increases in core inflation thanks to unprecedented increases in used car prices. The nearly 10% monthly jumps—sustained across a full quarter—pushed headline and core inflation up nearly 2%. Now that those months have faded from year-on-year calculations, elevated price growth from other core CPI items (namely, housing and other services) is likely to mix with base effects to bump core inflation up over the next few months—unless car prices somehow sink just as rapidly as they rose.
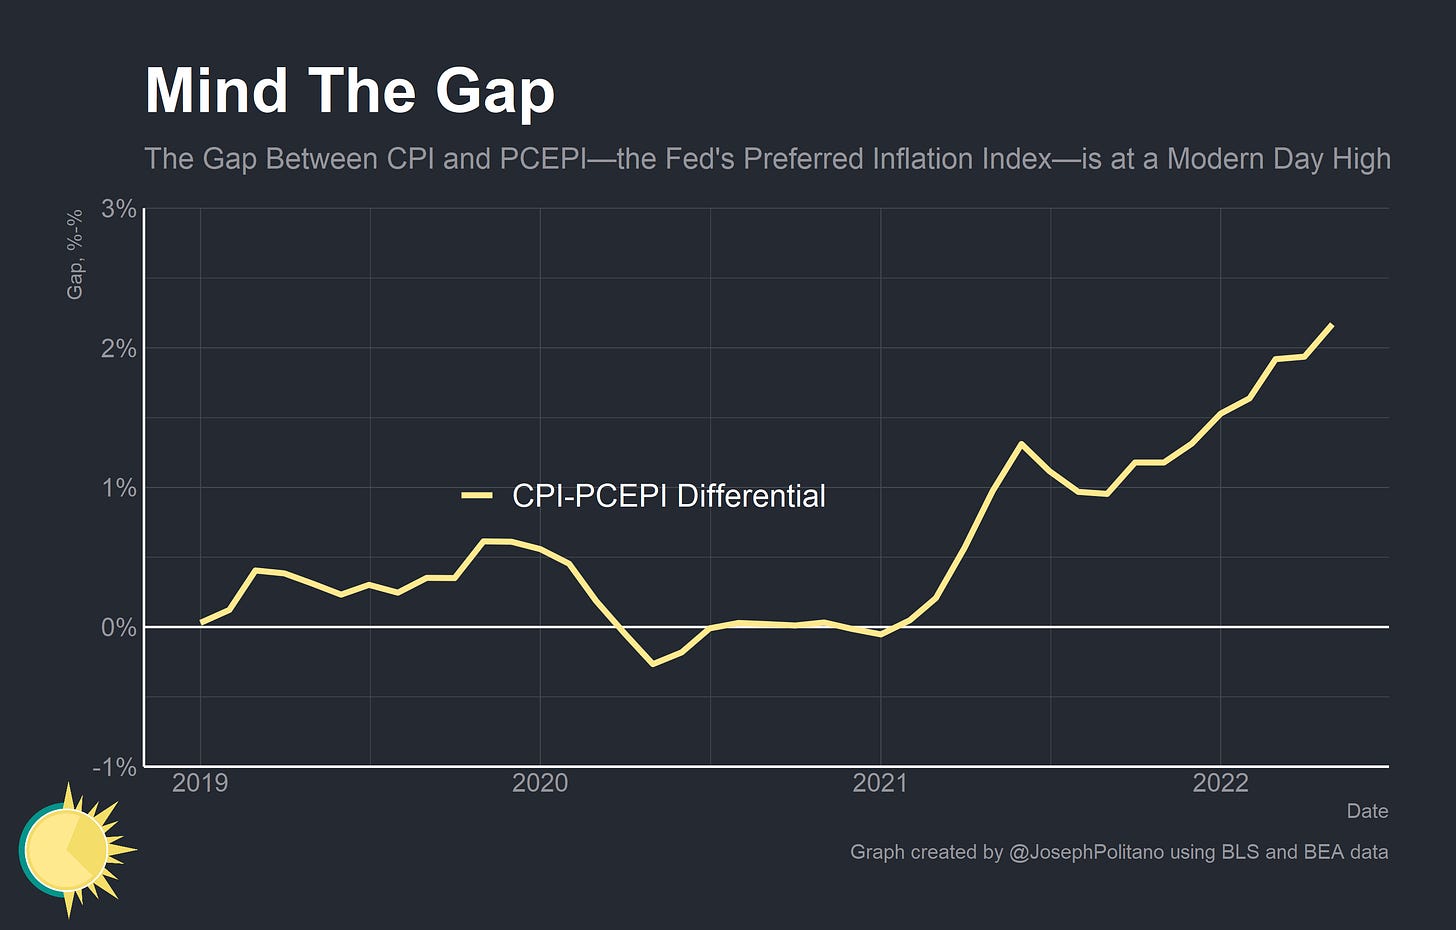
There’s also a critical, widening gap between the various measures of inflation in the US. CPI is most popular with the public—it comes out first and is designed to reflect the costs born directly by US consumers, so remains more directly applicable to the private spending of individuals. But the Personal Consumption Expenditures Price Index (PCEPI) is preferred by the Federal Reserve because it cover a wider variety of spending and employs more advanced weighting and methodological techniques. Normally the difference is fairly immaterial—CPI tends to run higher than PCEPI over the long run, but the difference between the two averages something like 0.3-0.5% per year. Not today—the gap between the CPI and PCEPI sits at more than 2% for the first time since the 1980s. That’s still small comfort when PCEPI is running higher than 6% and when consumers are focused on the high food and energy prices that make up a relatively higher share of CPI.
Looking Forward
There are some reasons for cautious optimism, though. Oil prices have retreated in recent weeks and gas prices have retreated further as refinery spreads—the cost to convert crude to refined products like gasoline—decline from near-record highs. Natural gas prices have also retreated as reduced capacity at a domestic Liquefied Natural Gas (LNG) facility in Texas prevents shipments from being sent to Europe. That could pull inflation significantly down in July, but it would still leave gasoline and natural gas prices at about double their 2019 levels.
Motor vehicle production in the US has also picked up significantly after slumping throughout 2021 thanks to an ongoing semiconductor shortage. For the last four months, output has been holding near normal-ish levels that are much higher than anything achieved since the start of 2021. Production is still below 2019 level and a significant shortfall of vehicles remains—meaning automakers still have to make up for lost time—but a reduction in car prices could take a large cut out of inflation if or when it occurs.
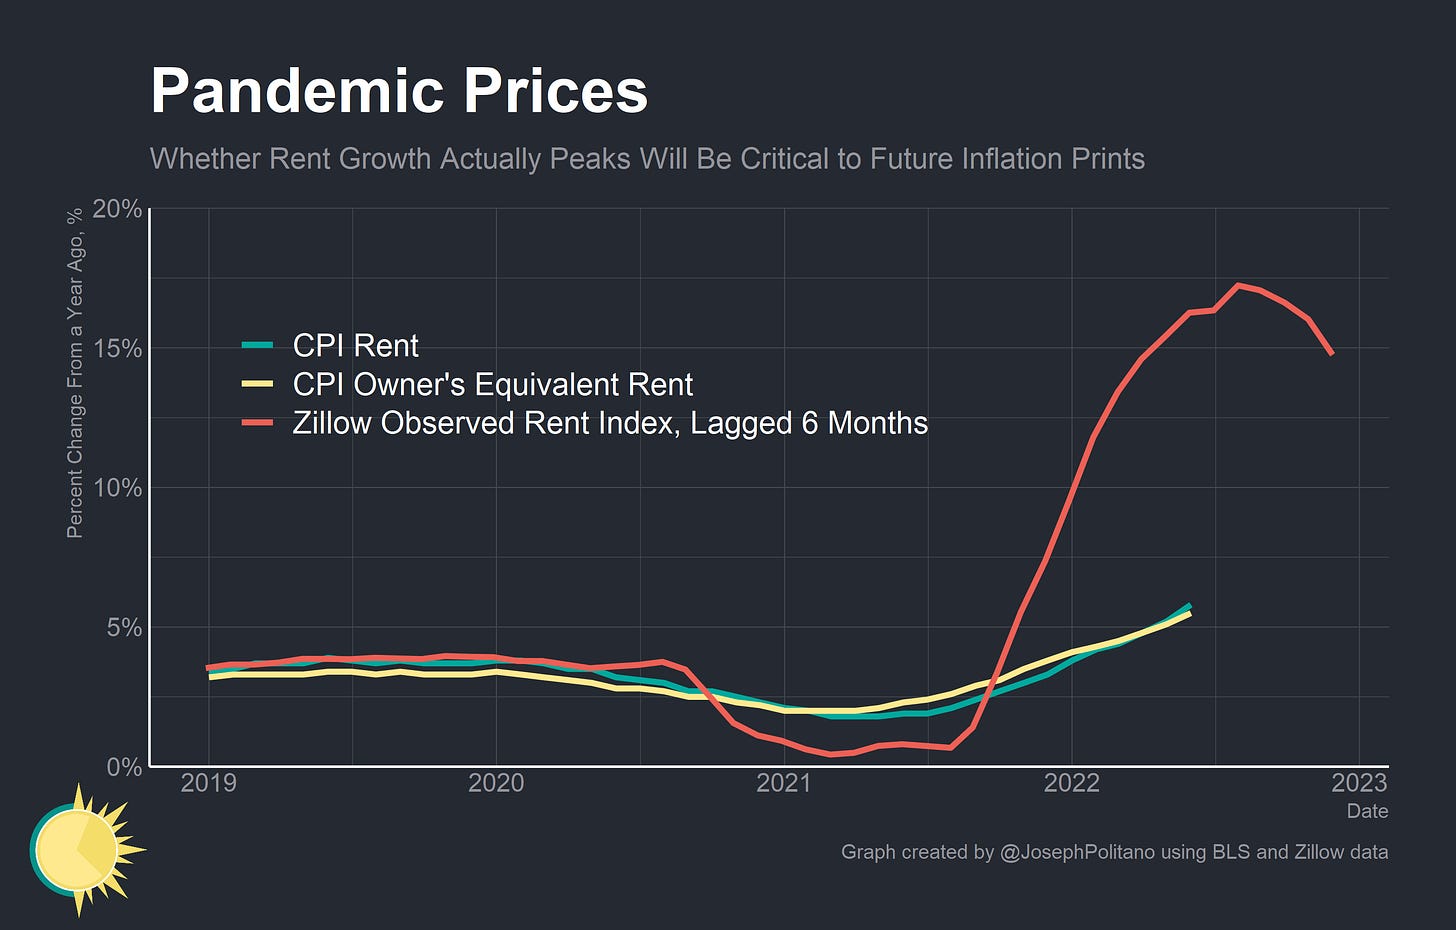
It’s housing prices, though, that will be critical to watch in the coming months. Shelter alone makes up 1/3 of the CPI, and its level of growth tends to be stickier than nearly any other item. Right now, rent prices are growing at the fastest monthly pace since the mid 1980s and are a significant contributor to high overall inflation. The good news is that rent price inflation may be declining—though still high by historical standards. Private data from Zillow and ApartmentList show a recent deceleration in housing prices that could filter through to CPI over the next 6 months to year. As we’ve discussed before, CPI’s rent measurements will not likely ever show the same rapid price hikes that private data observes simply due to the tendency for private data to overrepresent lease turnovers and exhibit some other sampling biases—but directional movement in real-time data could still be informative for future shifts in shelter inflation.
Conclusions
There are signs that disinflation could be coming—from commodity prices, inflation expectations, freight shipping rates, rising retail inventories, and more. Still, if there is anything the last few months should have taught us it’s that macroeconomic shocks can come out of the blue and cause unexpected downstream consequences.
Time will tell whether—and how much—disinflation will manifest and if inflation can be brought down easily. But in the meanwhile, it will remain critical to acknowledge and analyze the intricacies of inflation dynamics—because of, not in spite of, the high headline number.


>More difficult is that core services—the item that the Fed has the most control over—only represents 3% of current inflation.
This was interesting to me. Why is core services more under their control than core goods?
Thanks for providing additional granularity into inflation's disposition. I envision continued rate hikes and potential ad hoc austerity to curtail the slope.