A Special Preview of Critical Upcoming US Economic Data
Updated Jobs Data, Q4 GDP, Q4 Employment Cost Index, and More Come Out in the Next Two Weeks—Here's What You Need to Know
Thanks for reading! If you haven’t subscribed, please click the button below:
By subscribing you’ll join over 21,000 people who read Apricitas weekly!
Otherwise, liking or sharing is the best way to support my work. Thank you!
Getting a clear read on the US economy over the last year has been unusually difficult—different data series have been telling fundamentally conflicting stories about the current state of the economy and the short-term macroeconomic outlook. That’s been especially frustrating as the US enters a possible turning point with the Federal Reserve aggressively tightening monetary policy to combat inflation at the risk of an economic recession.
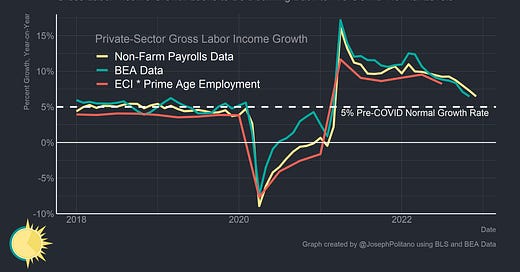
Earlier this year, different official measures of aggregate output and aggregate wages were telling opposing stories about the state of the economy, and though both of those discrepancies have since been resolved (to the downside) critical data gaps still remain. In particular, recent data releases on job and wage growth have been volatile and often contradictory—with the two halves of regular jobs reports pointing in entirely different directions about the state of the labor market.
As I’ve written about these data discrepancies throughout 2022 I’ve ended my pieces with a constant refrain: we have to wait for more information in order to paint a more complete picture of the economy. The good news is that we may not have to wait much longer: critical upcoming data releases and annual data series updates may answer many lingering questions about the current state of the American economy—and this new information will start coming out in a flurry starting now:
Tomorrow, January 26th we will get Q4 and full-year 2022 GDP data
Next Tuesday, January 31st we will get Q4 2022 Employment Cost Index (ECI) data
All of these releases carry important new information for the baseline understanding of the US economy, its future outlook, and the Fed’s reaction function, so it’s worth breaking them all down in depth before the data comes out.
(Maybe?) Solving the Labor Market Mystery
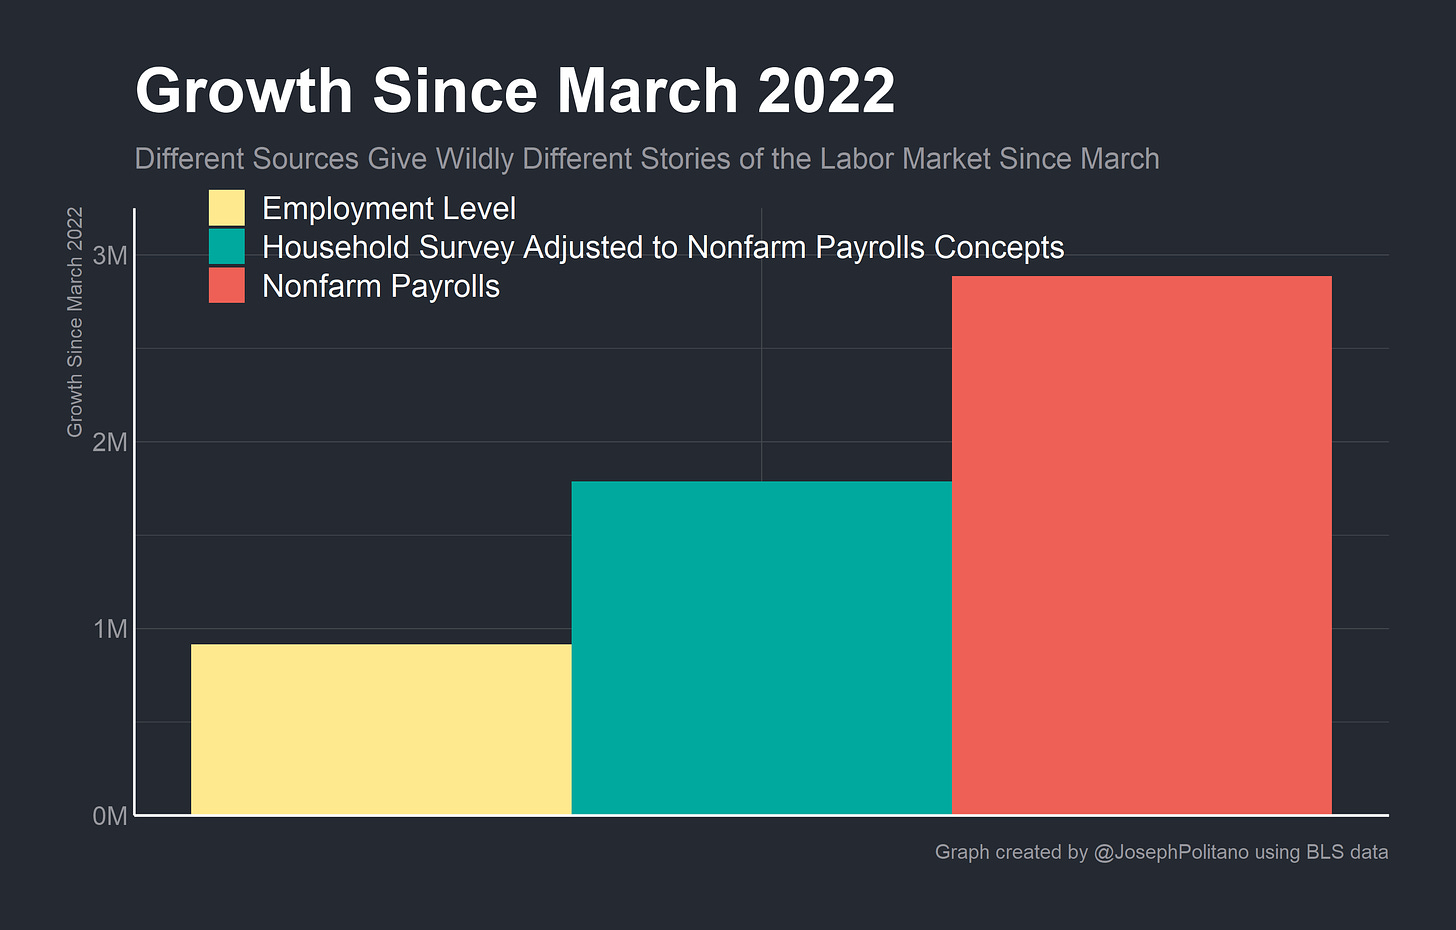
Over the last year, a big discrepancy has emerged between America’s two main measures of job growth: nonfarm payrolls, which are measured via surveys of business establishments, have grown by nearly 3 million since March of 2022 while employment levels, which are measured via surveys of households, have grown by less than one million.
That gap still exists, albeit smaller, when adjusting for the conceptual differences between employment levels and nonfarm payrolls (namely, that multiple jobholders count once in employment levels and twice in payrolls, and that the self-employed and agricultural workers are excluded from nonfarm payrolls). Since I last wrote about the discrepancy in November it has narrowed considerably—and employment growth is at least positive now—but we’re still waiting for a final resolution that will hopefully bring the two numbers back in line. That resolution might come with the jobs data released on February third—which includes annual updates to payroll benchmarking, population controls, and seasonal adjustments.
First, the population controls: calculating employment and unemployment is essentially a process of surveying a sample of households, weighing the results, and then projecting the results onto estimates of the size and composition of the total US population. If you survey 100 people and 2 are unemployed, you can only calculate the total number of unemployed Americans by extrapolating the results of the survey of 100 onto a total US population estimate (to be specific, the estimated US 16+ civilian noninstitutional population).
At the start of every year, the Bureau of Labor Statistics updates the population controls using new information from the Census Bureau on the size and composition of the US population. This can have big effects on labor market data—if population numbers are revised upward (say, if net immigration was underestimated) then employment levels could also be revised upward. Critically, employment/unemployment rates can also move—if the composition of the population is revised (say, if deaths among Americans 65+ came in lower than expected) then the age composition of the labor force also changes, which can affect the overall share of workers employed/unemployed.
Last year we saw big revisions to population estimates—with the total civilian population increasing by nearly 1 million people thanks in large part to the incorporation of 2020 census data. Unsurprisingly, population levels have been volatile and hard to predict during the pandemic, so it’s possible we’ll see another large revision next week—and a significant upward population revision would resolve a lot of the remaining discrepancy in jobs data. It’s also worth noting also that BLS doesn’t revise prior data with new population estimates, so employment numbers could end up with a noticeable jump in January if the shift in population controls is significant.
But that’s not the only big update to jobs data next week—nonfarm payroll numbers will also be revised to incorporate updated benchmarks from more comprehensive administrative data. These yearly updates are designed to ground the monthly estimates from the establishment survey in more robust numbers and to account for business creations and bankruptcies that can drive job gains and losses.
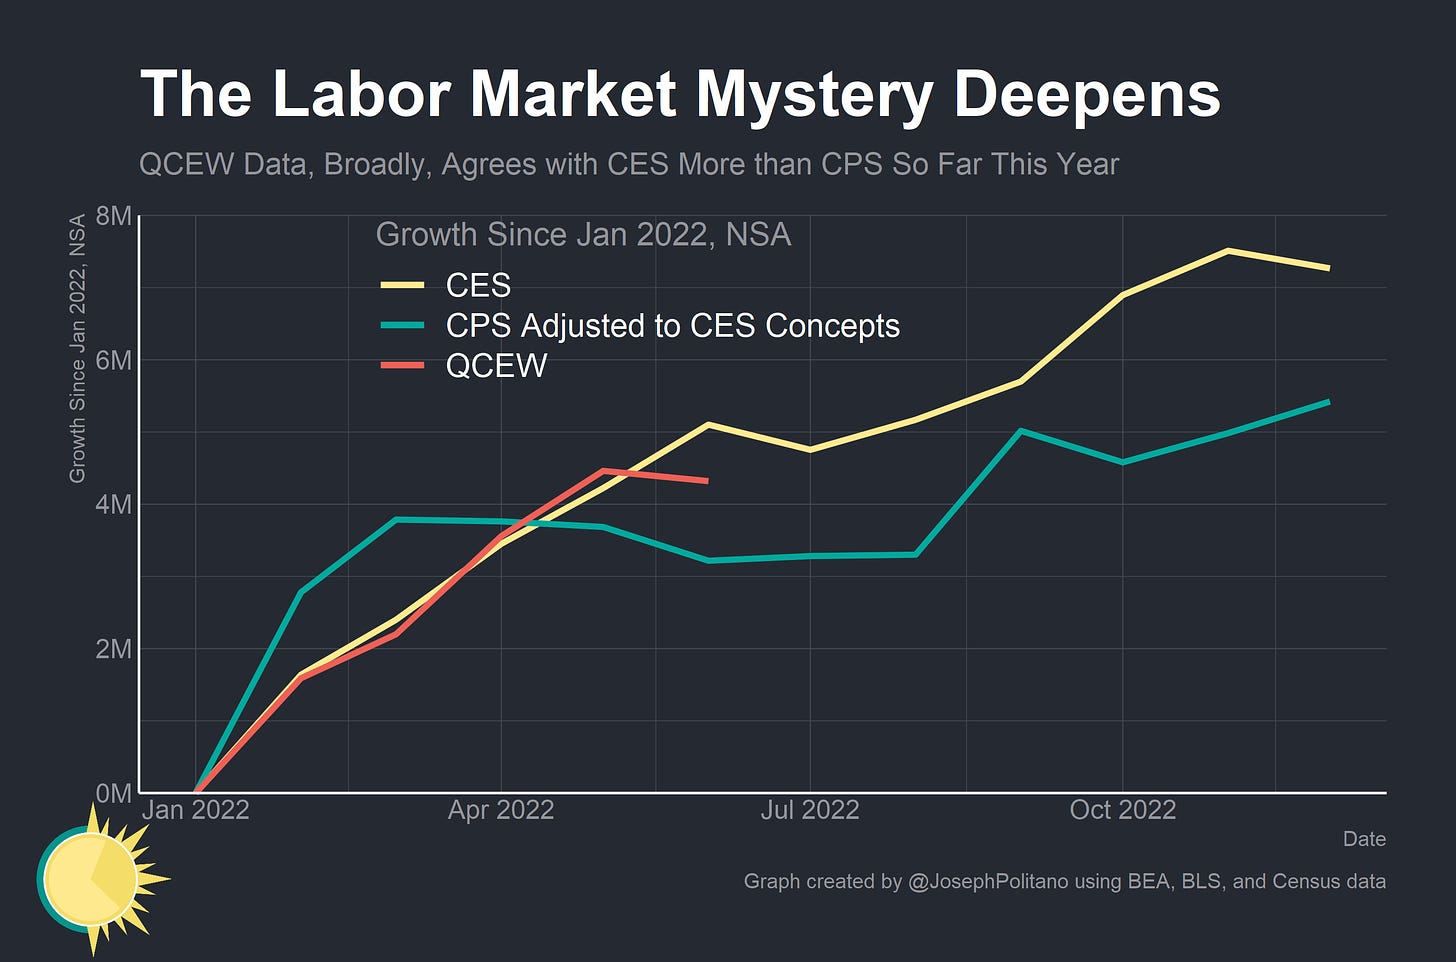
That more comprehensive data comes from the Quarterly Census of Employment and Wages, and the preliminary estimate from the BLS suggests that we’ll see a nearly 500k job increase (specifically for the month of March) as a result of the benchmarking process. That’s where the story gets a bit more complicated, though—right now we only have QCEW data through Q2 2022, and in the last month of Q2 we saw a serious divergence between the not-seasonally-adjusted QCEW data and CES data—with QCEW data showing worse job growth outcomes. The Business Employment Dynamics data released today might shed some light on this—it’s the first official seasonally-adjusted QCEW-derived estimate of job growth in Q2—but it’s actually some key experimental data from the Philadelphia Fed that is currently providing early and somewhat conflicting signals on the possible outcome of the benchmarking process itself.
Keep reading with a 7-day free trial
Subscribe to Apricitas Economics to keep reading this post and get 7 days of free access to the full post archives.


