Americans' Excess Savings Are Mostly Spent
The Trillions of Extra Dollars Americans Saved During the Early Pandemic Have Been Spent Down Rapidly in the Last Year
Thanks for reading! If you haven’t subscribed, please click the button below:
By subscribing you’ll join over 28,000 people who read Apricitas weekly!
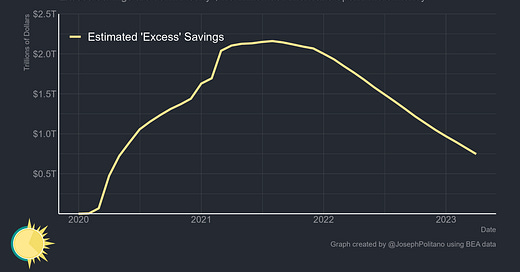
At the start of the pandemic, Americans accumulated trillions of dollars in excess savings—workers dramatically cut back on their consumption, households received generous relief payments from the Federal government, and borrowers refinanced their debt at newly-lowered interest rates, so people were earning significantly more in aggregate than they were spending. The end result was more than $2T in total savings above what would be expected in a hypothetical no-pandemic world, with the bulk of those assets concentrated among high earners. However, by 2022 the script had completely flipped—Americans were spending much more than they would normally, drawing down on their excess savings, and re-engaging in debt amidst a consumption boom partially caused by and partially enabling ongoing inflation. Today, most of those excess savings have been spent down, with households only having an extra $750B remaining (or about $650B accounting for inflation).
The deterioration of that excess savings cushion has represented a major loss in financial security—the share of Americans who said they were worse off last year rose to the highest level in nearly a decade, with fewer now saying they were financially comfortable or could survive a financial emergency. At the current pace of spending, virtually all excess savings will be drained by the end of 2023—taking the wind out of some of the excess spending that’s been driving inflation. Yet at the same time, that would place household balance sheets in an even worse position just as the Fed is aiming for decelerations in income growth, tighter credit conditions, and higher interest rates. America’s pandemic-era financial buffer is weakening, and that could leave consumers and the nation’s economy in a more precarious situation.
Understanding Excess Savings
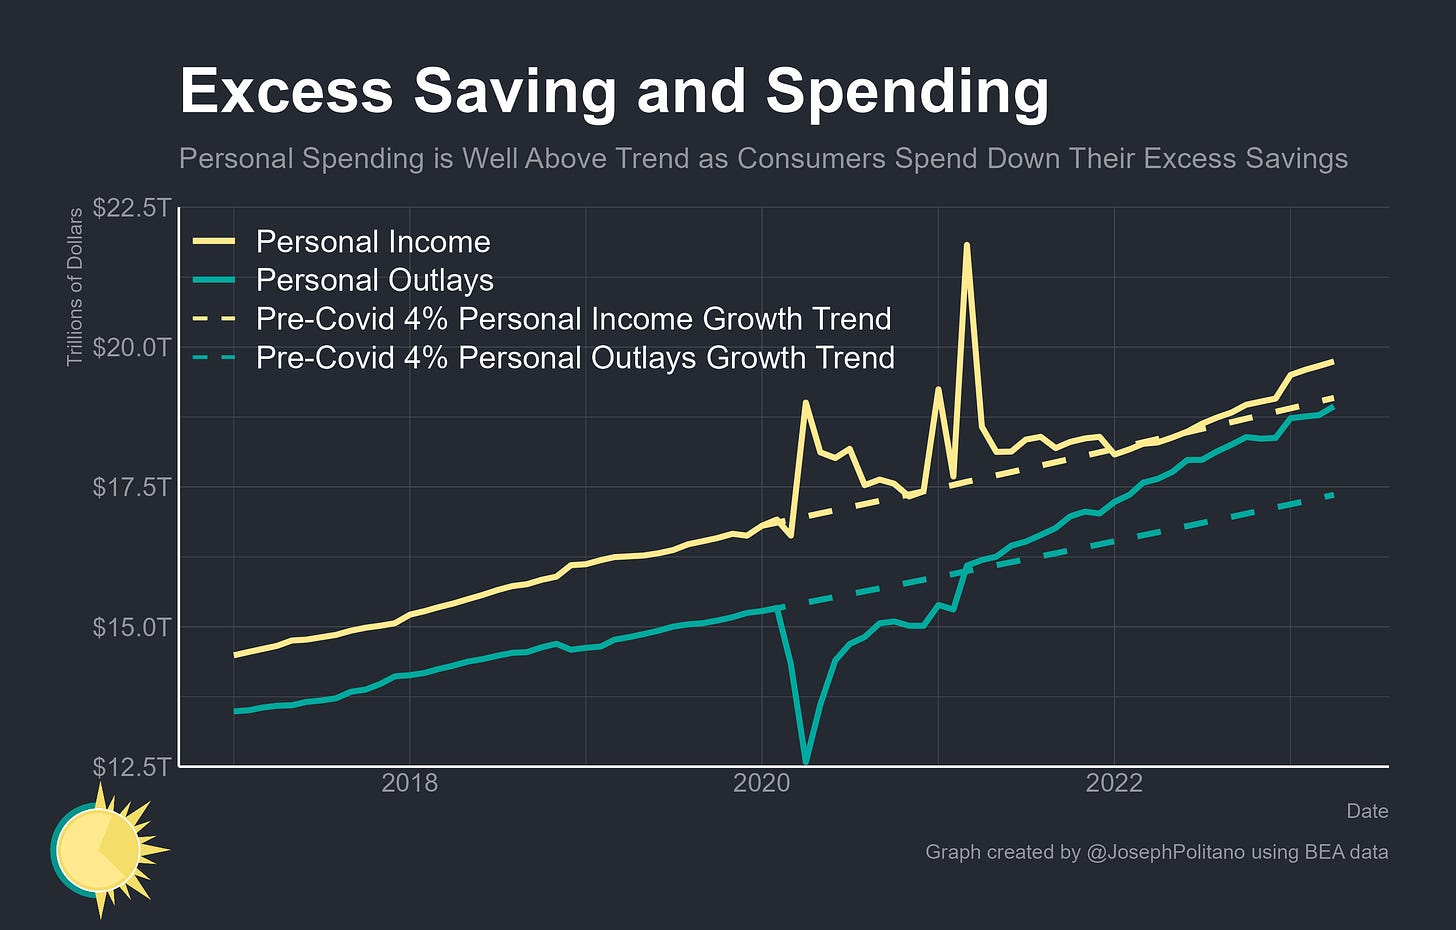
Excess savings is a complicated concept, subject to a wide variance in estimates depending on how one measures baseline “normal” savings and defines what should and should not count as “savings.” My approach has been to take disposable personal income (that is, aggregate income net of taxes) and personal outlays (that is, consumption spending plus interest and transfer payments) and project them forward at the 4% growth rates they approximately held pre-pandemic. Cumulative net spending below the pre-pandemic trend and cumulative net income above the pre-pandemic trend combined represent excess savings—or in simpler terms, excess income minus excess spending is excess savings.
From that perspective, a clear pattern emerges. First, in 2020 and early 2021 personal income remained well above trend thanks to government stimulus payments while personal outlays remained well below trend as consumers stayed inside and cut back on spending, leading to a surge in excess savings. By 2021 income and outlays had both normalized slightly above the pre-pandemic trend, keeping savings largely stable. Then in 2022 income growth decelerated while spending growth skyrocketed, leading to a rapid drawdown in excess savings that has continued into 2023.
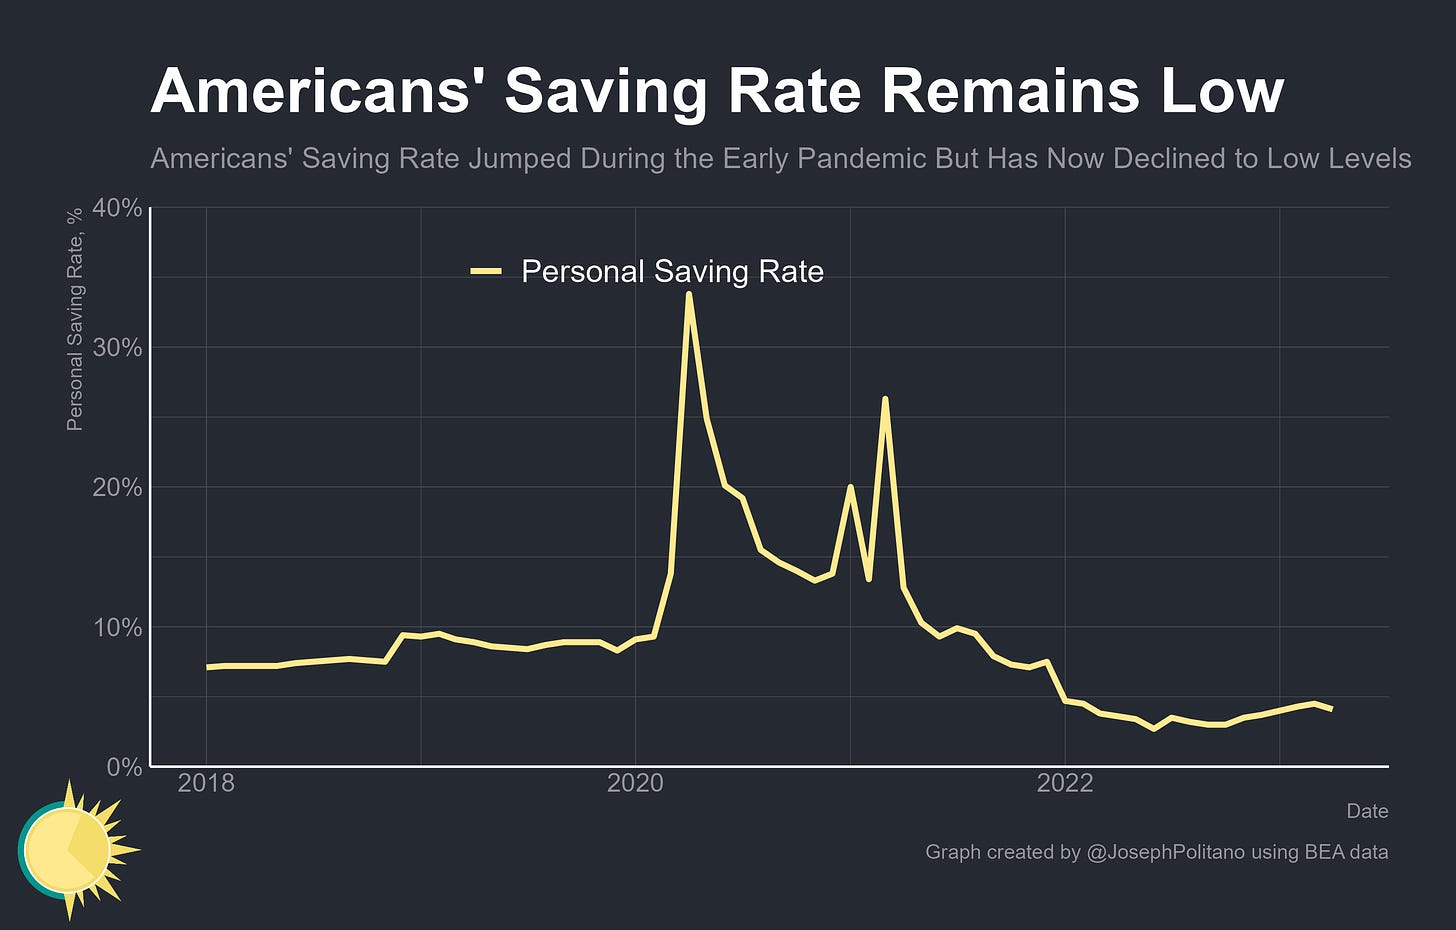
The aggregate savings rate has picked up from its June lows, but still remains well below pre-pandemic norms and is only marginally above the levels seen during the household stress periods in the years leading up to the Great Recession. Savings rates would have to nearly double to catch up with 2019 levels, meaning they will have to rise fast if Americans are to avoid completely running out of excess savings.
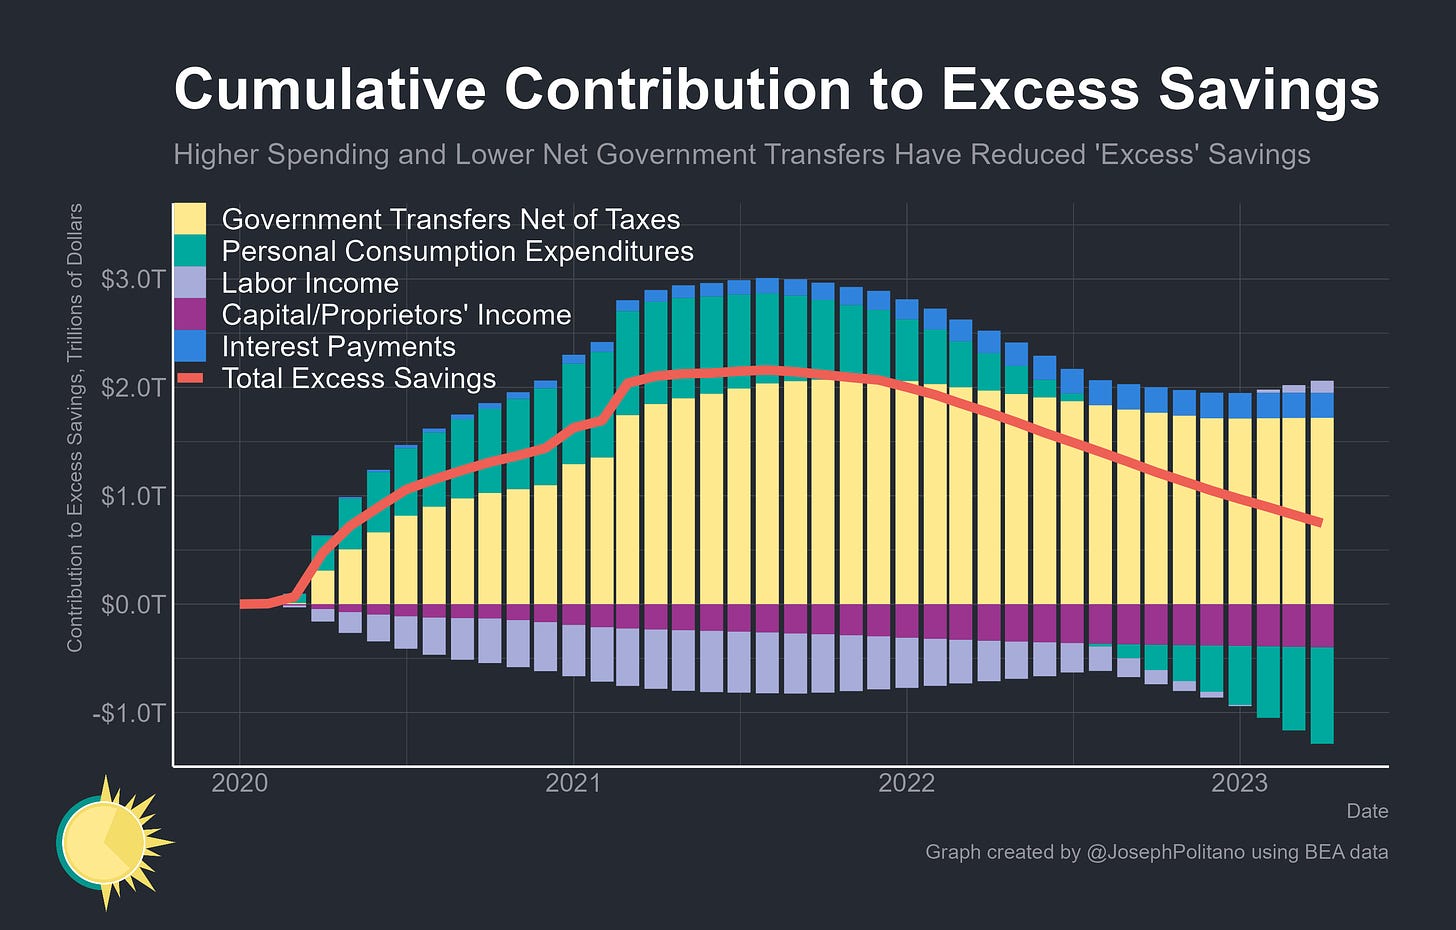
Decomposing cumulative excess savings into its components, we can clearly see that rising consumer spending has been the main driver of the recent drawdown in household savings. Between February 2021 and April 2023 cumulative personal consumption expenditures went from $975B below pre-pandemic trends to $891B above pre-pandemic trends, a swing of more than $1.8T that represents the bulk of movements in excess savings. Higher labor income (a result of rapidly growing aggregate wages) and higher tax levels (driven by the growing labor market and particularly large capital gains tax payments) have also cut into personal savings, but by nowhere near as much as the shift in consumption. At the current pace, above-trend consumption is chewing up more than $100B in excess savings each month and will have completely drained all excess savings by the start of 2024. Indeed, real disposable personal income has essentially flatlined since the start of 2021—it is only the drawing down of excess savings that has enabled real consumption to continue growing.
Yet it is important to acknowledge that this approach, while useful, has many limitations. For one, not all excess savings represent liquid assets that can enable future consumption; cash is counted as personal savings but so are home improvements, retirement contributions, paying down student loans, buying cryptocurrency, and more. For two, the definitions of “personal income” and “personal outlays” don’t square up nicely with what most people mean by those terms; capital gains are not counted as increasing disposable personal income but capital gains taxes are counted as decreasing disposable personal income, dividends are likewise counted as personal income but not stock buybacks, and interest rate drops result in declines of personal outlays but forbearance on principal payments does not. Excess savings are fundamentally an accounting identity—they represent unusual household surplus and can therefore only be “drained” via transfers to the government (in the form of taxes or reduced transfers), to the corporate sector (in the form of profits that are not redistributed back to households as dividends), or the rest of world (in the form of imports, interest payments, or foreign companies’ undistributed profits). They’re useful, but only part of the story—looking at households’ net worth and financial assets is required to get the full picture.
The Net Worth Approach to Excess Savings
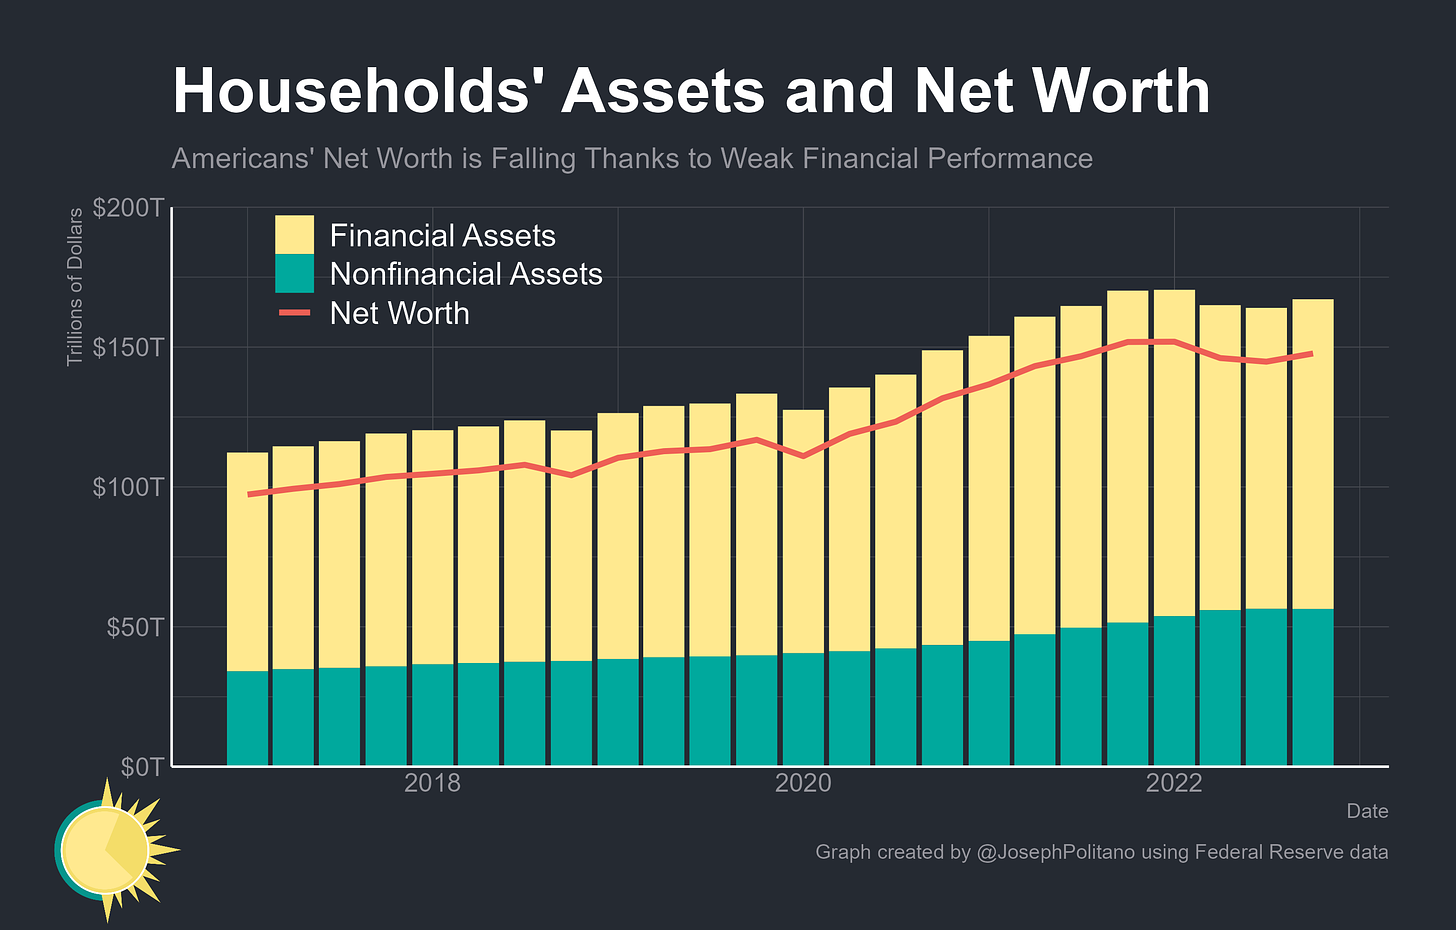
From a net worth perspective, Americans have nearly $7T in excess savings remaining, down from nearly $20T at the end of 2021, presuming the roughly 6.2% annualized increase in net worth seen in 2018 and 2019 would continue apace in the absence of the pandemic. That’s thanks in large part to a surge in owner’s equity in real estate (up $11T since the end of 2019), stock market assets (up $4.8T), and cash assets (up $4.9T). The importance of the surge in real estate and cash is worth noting for their more direct relationship to consumption than many financial assets—Americans are more likely to consume out of increases in real estate wealth than equivalent increases in stock-market wealth in part because more real-estate wealth is held by middle-class people than stock-market wealth, and the rise in cash holdings represents a large pool of liquid assets that can be easily drawn on to support consumption.
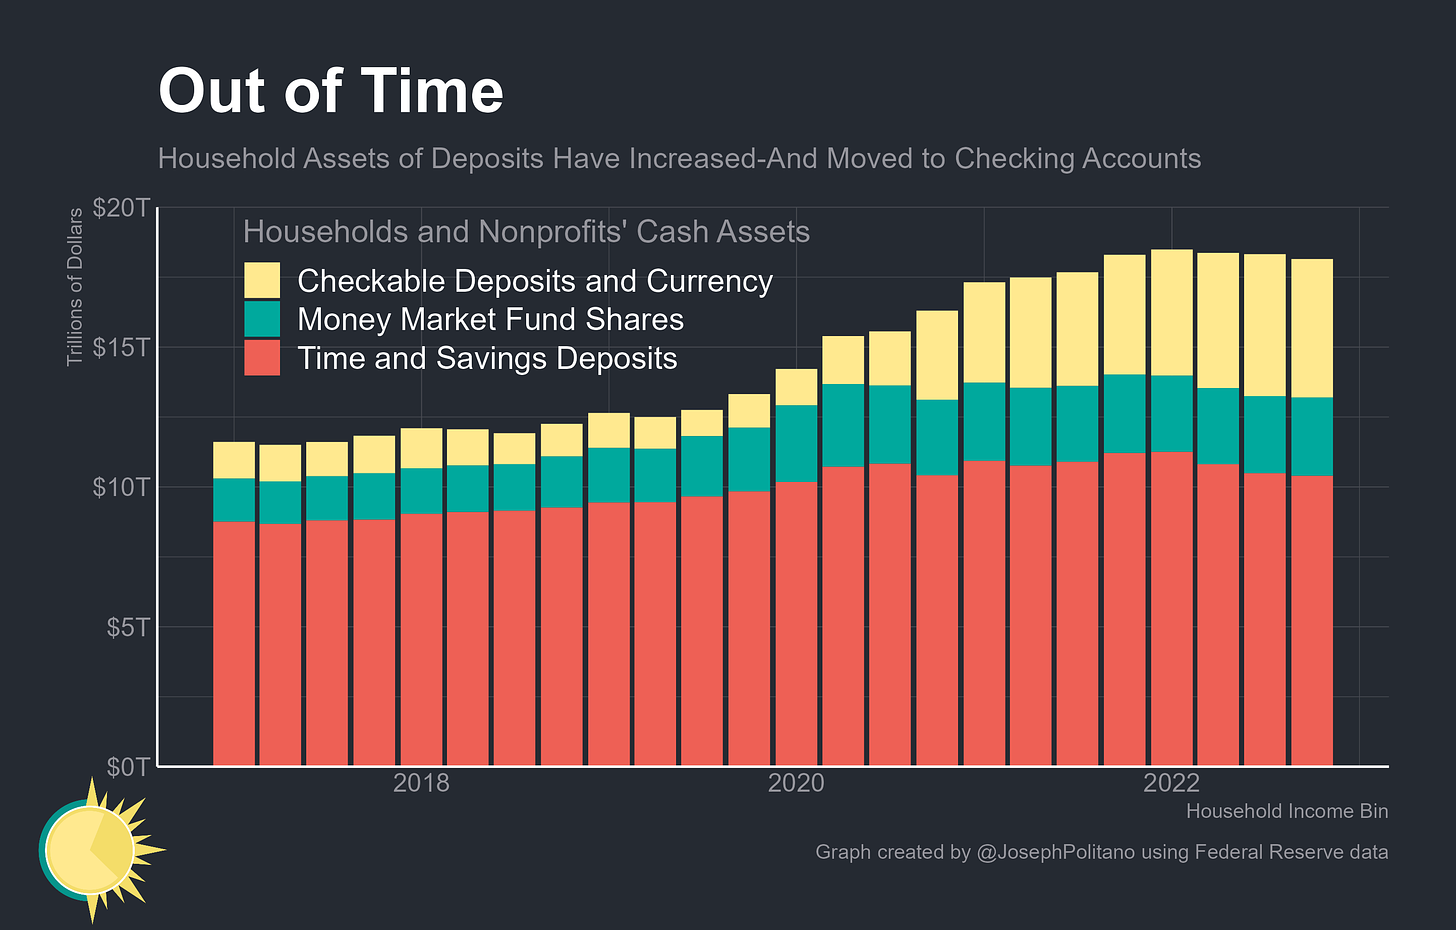
Household cash assets, particularly demand deposits, increased rapidly during the early pandemic and still remain elevated even as they decline slowly and lose value in inflation-adjusted terms. Not even the recent banking crisis or higher interest rates have made a dent in demand deposit levels, with recent declines in aggregate deposit levels being mostly attributable to falls in savings and time deposits. Even though cash balances have fallen slightly, households have seemingly settled on an equilibrium where they hold higher checking account balances relative to their incomes. Those extra cash balances represent the purest form of excess savings—higher relative liquidity that households have yet to completely draw on.
American Households are Still Stressed
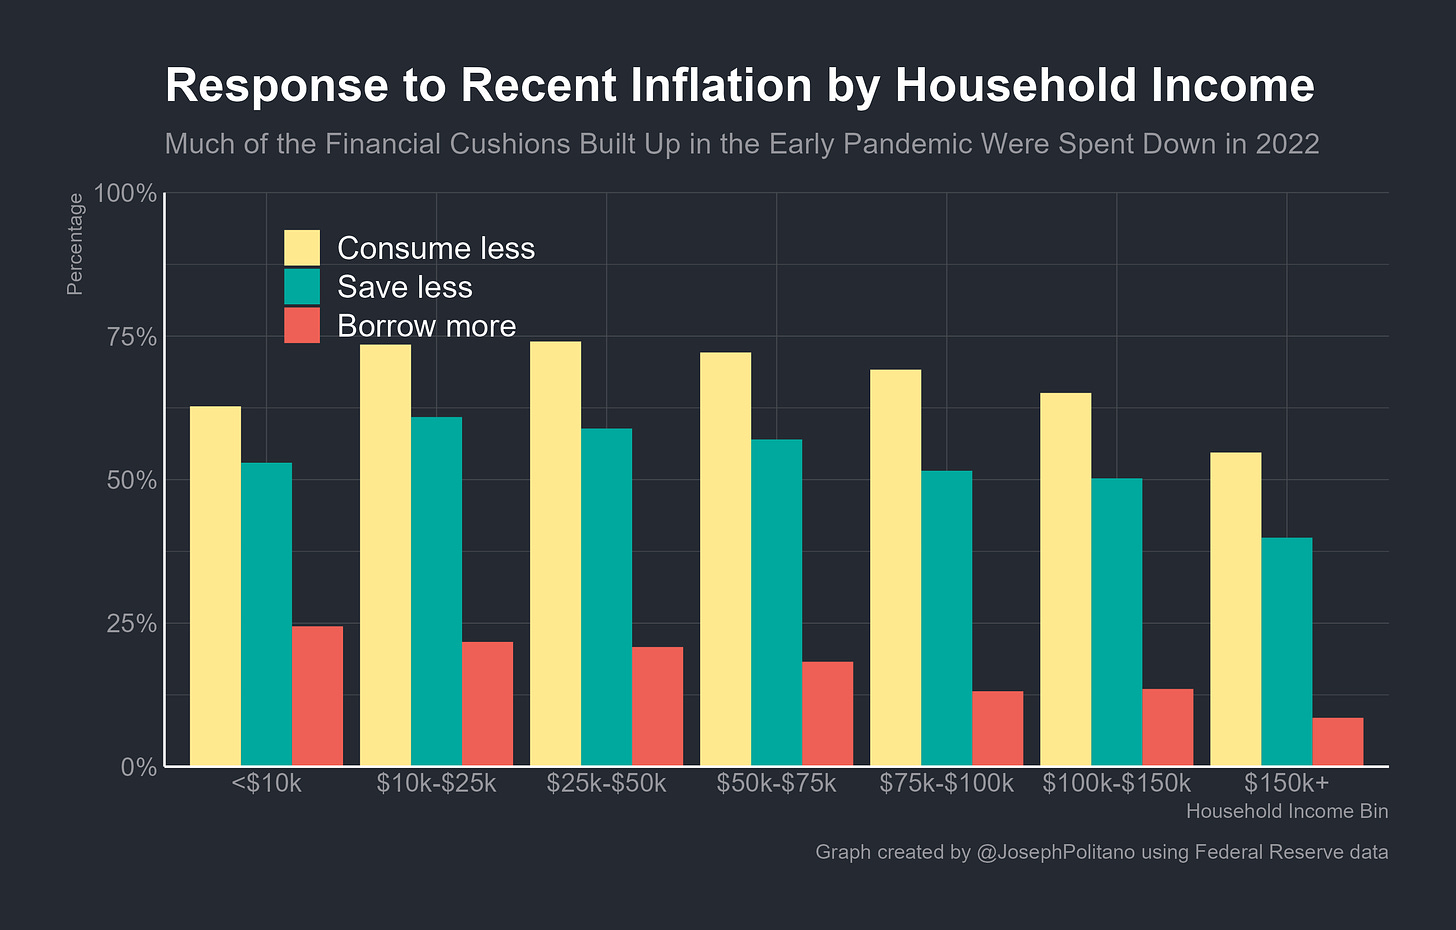
However, no matter which way you cut it it’s clear that recent inflation and the economic slowdown are putting tremendous strain on American households. The Federal Reserve conducts the Survey of Household Economics and Decisionmaking (SHED) every year to track Americans’ financial health, and the recently-published survey data from last year included several questions on the impact of high inflation. Americans across the board reported cutting back on real consumption, saving less, and borrowing more in response to recent price increases, with those at the bottom end of the income distribution being more likely to turn to debt and those in the middle more likely to cut back on consumption or saving. Only 49% said they were spending less than their income last month, compared to 55% in 2020 and 2021, while 18% said they would not be able to pay this month’s bills in full, the highest share since 2018.
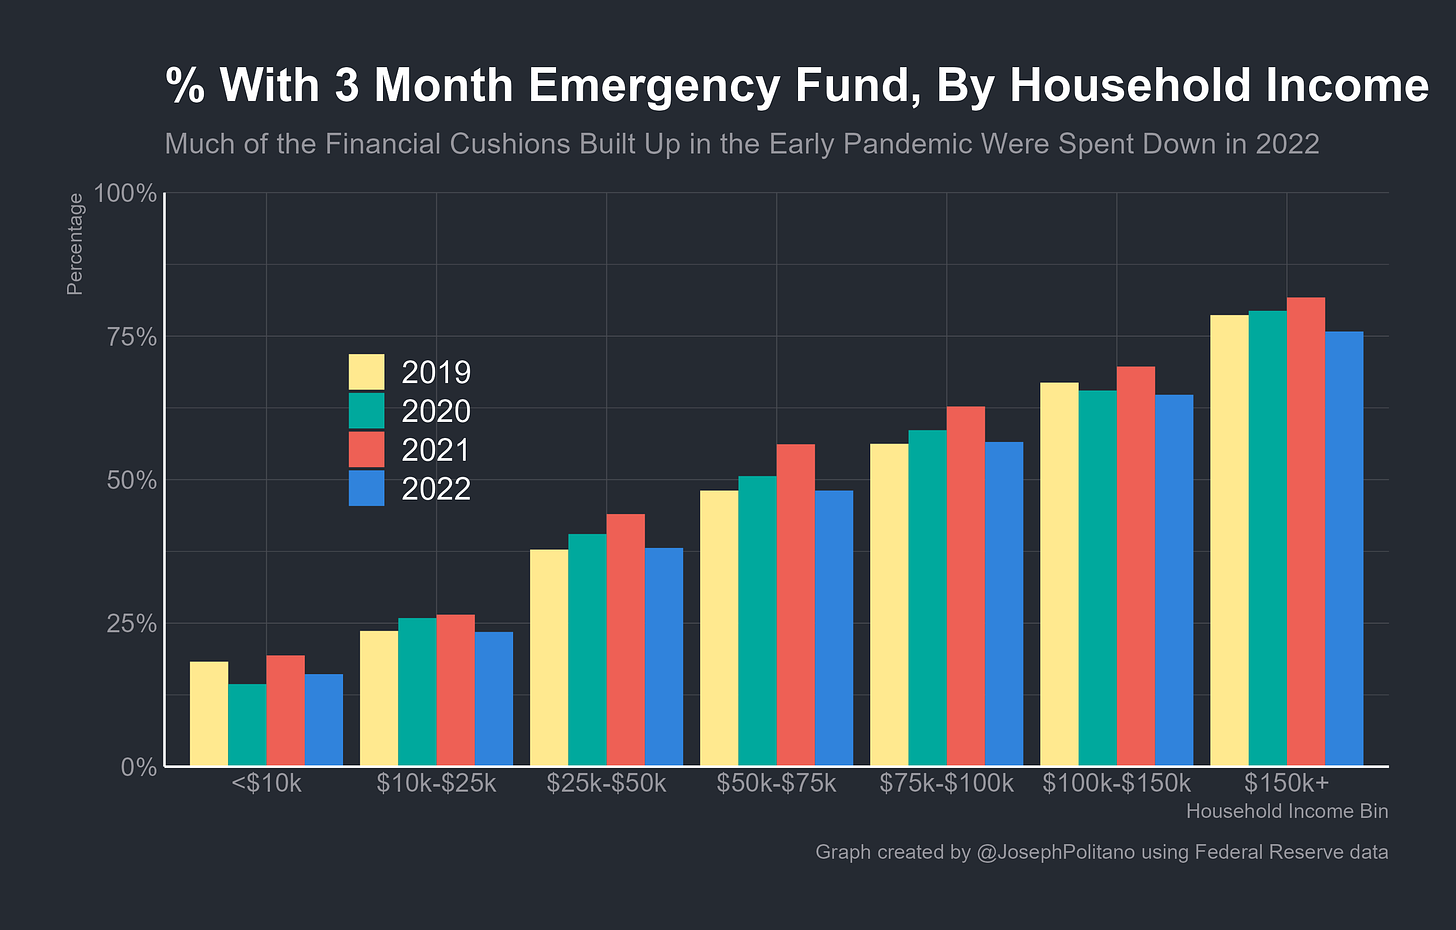
Indeed, from most families’ perspectives, the excess savings accumulated during the pandemic are now entirely gone. The share of households saying they had savings worth 3 months of expenses dipped to just above pre-pandemic levels, with higher-income households being noticeably less likely to have a sufficient emergency fund than they were in 2019.
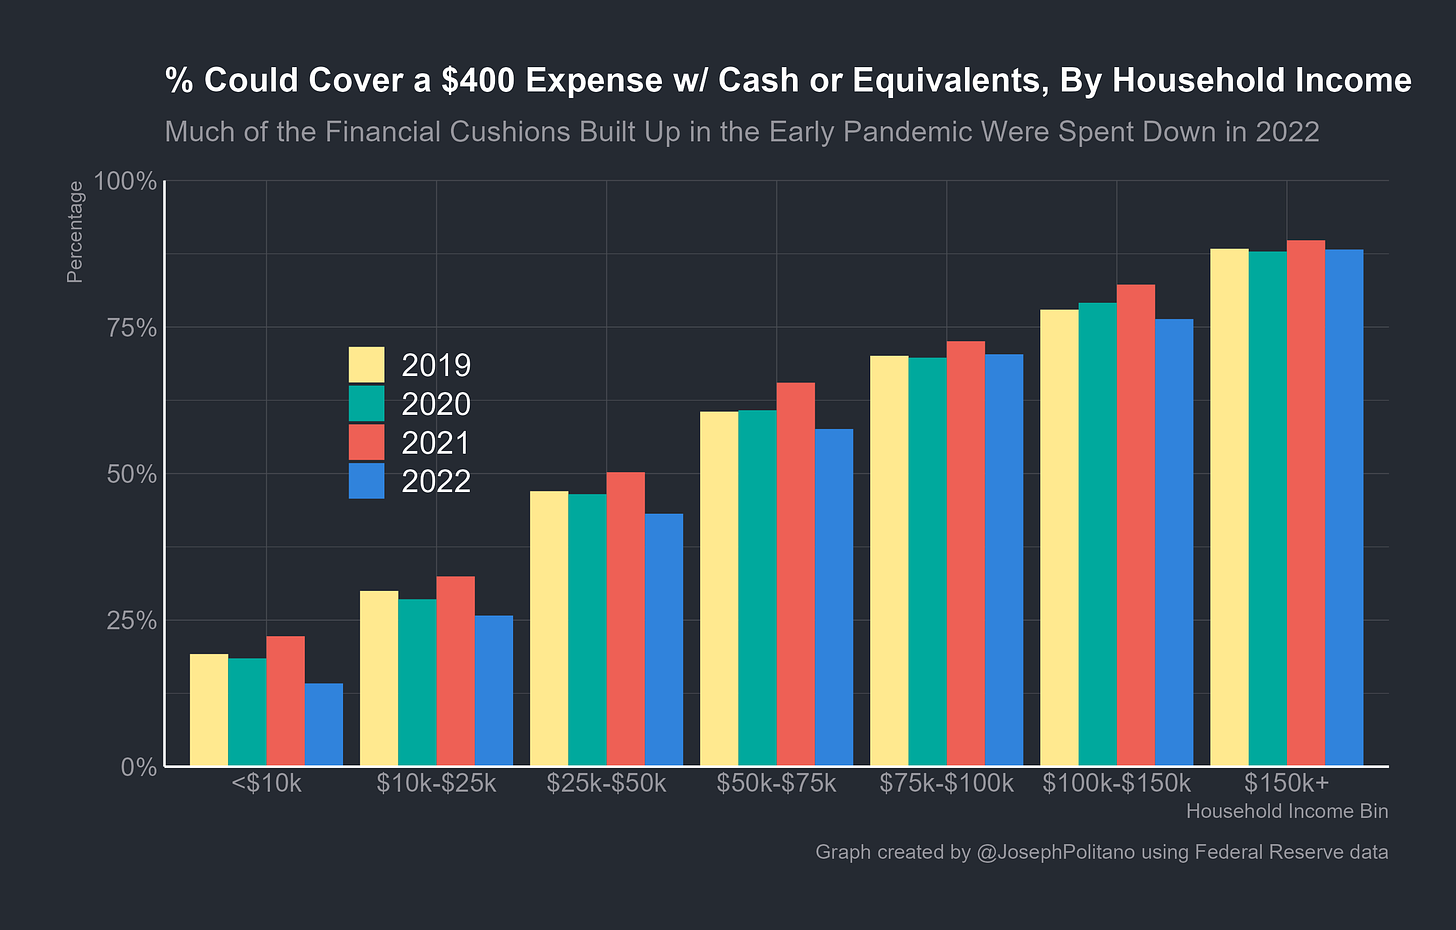
Likewise, the share of households saying they could cover a $400 emergency expense with cash or its equivalents dipped to pre-pandemic levels, despite the fact that a $400 expense in the 2022 survey period had roughly the equivalent inflation-adjusted value as a $345 expense in the 2019 survey period. The declining liquidity was most noticeable in households making the median income and below, who almost were substantially less likely to be able to meet an emergency expense than in 2019. Deteriorating financial health among this cohort is likely a large part of the reason that debt delinquency rates are renormalizing from their pandemic-era lows and why consumer debt levels have risen at the fastest pace in a decade.
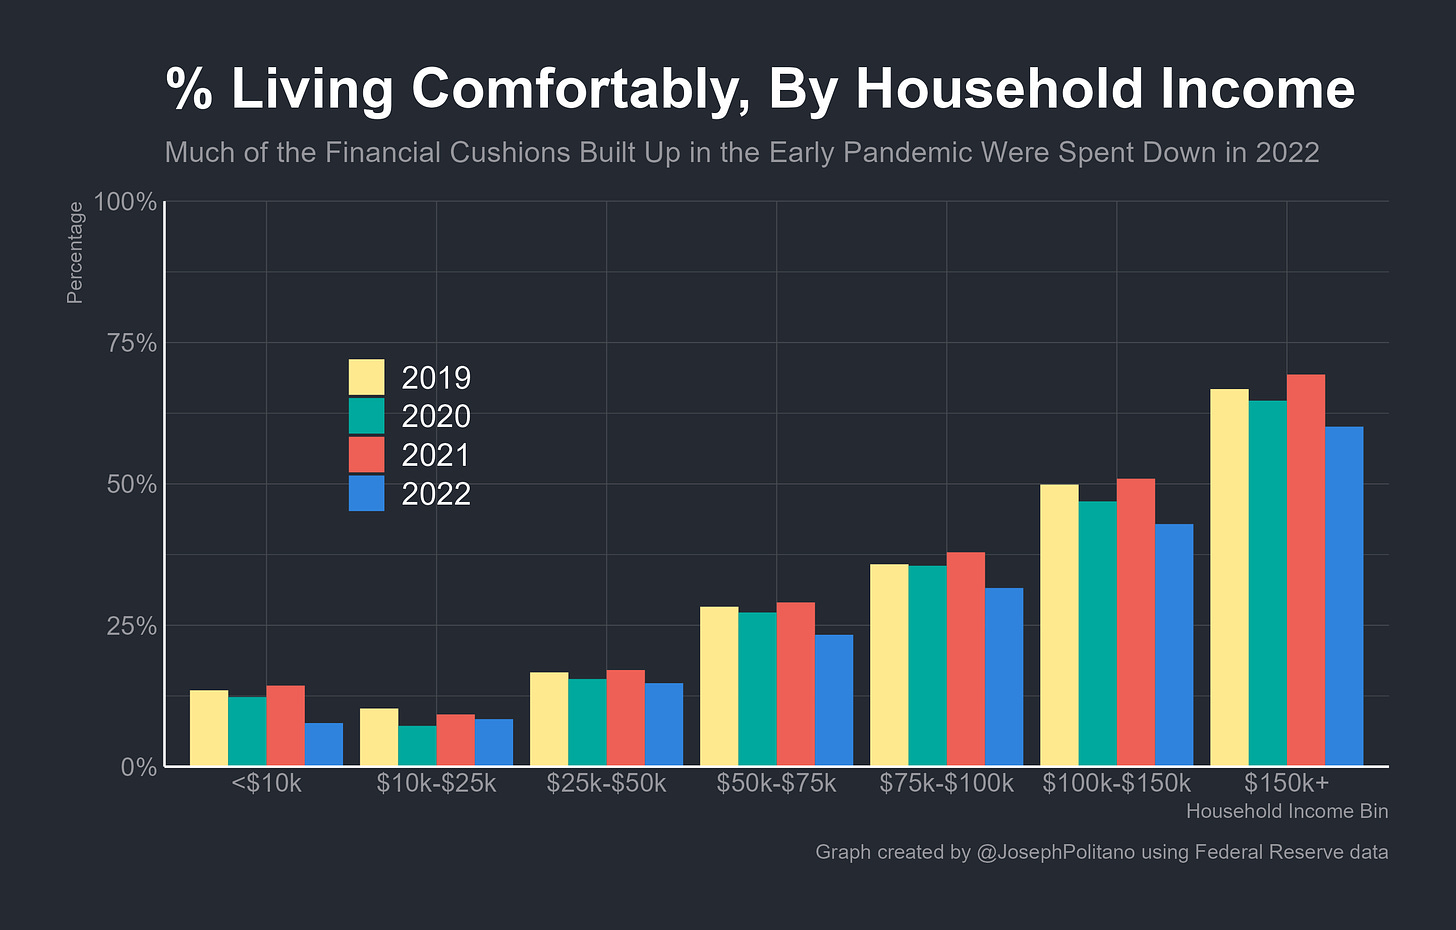
The end result is that the share of Americans saying they’re “living comfortably” has dipped below pre-pandemic levels and the share doing “at least okay” has fallen to the lowest levels since 2016. Only 38% think their local economy is doing “good or excellent” and only 18% think the same about the national economy, both of which are the lowest levels recorded since the survey began asking in 2017. In short, the return of inflation and the end of excess savings have left Americans feeling more precarious than they did before the pandemic, and have made their perceptions of the broader economy decidedly pessimistic.
Conclusions
In many ways, the path of excess savings was the biggest unknown variable in the COVID-era economy—the only close comparable economic events in American history were the ends of World War Two and the Spanish Flu, neither of which seemed to provide much of a guide to the 21st century’s greatest pandemic. If anything, those examples from history drastically underestimated the speed and share of excess savings that have been spent down in the last year.
It didn’t help that, from a data perspective, we were flying somewhat blind—The Federal Reserve’s Survey of Consumer Finances (SCF), the most comprehensive existing survey of American income, spending, and balance sheets, is conducted on a 3-year cycle, the most recent of which was in 2019. We will unfortunately never know in detail precisely what household balance sheets looked like in 2020/2021. Surveys like SHED also have a hard time measuring the country’s ultra-rich, which make up a small share of normal surveys’ samples but a very large share of aggregate financial flows and spending, and the SCF therefore forms the basis for the Distributional Financial Accounts and other comprehensive financial asset breakdowns that are essential for understanding the makeup and owners of excess savings. We’ll get a better picture when 2022 SCF results are released at the end of this year, but only in retrospect.
Historically, most Americans are extremely illiquid and most consumers have little ability to regularly spend beyond their incomes. For most households that means aggregate consumption moves in line with income, in particular wages, and a lost job, deteriorating economy, or a personal emergency can require significant cutbacks in personal spending. In recent years, excess savings enabled many to consume slightly more than they earned and build up a personal buffer against economic shocks—but that era might be over just as quickly as it began.



Very clever graphs and insight into a complicated subject. Thanks Joseph and Happy Memorial Day Weekend
"At the current pace of spending, virtually all excess savings will be drained by the end of *2023*"?