America's Economy Was Bigger Than We Thought
Comprehensive Revisions to US GDP Data Show a Larger Economy and a Stronger Recovery
Thanks for reading! If you haven’t subscribed, please click the button below:
By subscribing you’ll join over 35,000 people who read Apricitas weekly!
The US economy was larger than we thought, and its recovery from the pandemic was stronger than previously believed. Those are the broad conclusions of the comprehensive and annual revisions to America’s national accounts data published last week—they showed US GDP was 1.7% higher than previously reported and that cumulative real growth since the start of 2019 was 6.3% instead of 5.6%.
These revisions are part of a regular process where the Bureau of Economic Analysis (BEA) incorporates more comprehensive data sources into its estimates of American output—however, this year’s revisions were especially important for the wealth of new information they added. Every five years, the BEA integrates extremely detailed information derived from the Economic Census, which leads to extensive changes to official data stretching back several years—and this was the first such comprehensive update since the beginning of the pandemic.
These revisions also provide an opportunity for the BEA to improve the methodology they use to measure GDP, usually to account for shifts in the US economy that have occurred since the last comprehensive update. This year, that included detailed measures of housing services, new measures of interest paid by the Federal Reserve, changes to estimates for software investment, better measures of construction costs for renewable power plants, and new quality adjustments for cloud computing prices—among many other improvements. Plus, the BEA added several new data series to expand their coverage of the US economy—including official releases of the core-services-ex-housing price index the Fed has been focusing on, breakdowns of electric power investment, more detail on foreign trade, and expansion of motor vehicle data.
These revisions also came at a key time for the US economy and helped clarify some of the contradicting signals previously coming from official data. Going into last week, one of the biggest questions was about the growing gap between Gross Domestic Product (GDP) and Gross Domestic Income (GDI). Theoretically, the two should be precisely equal—all of the consumption, investment, and other expenditures of GDP must necessarily induce equivalent wages, profits, and other incomes in GDI—yet because their calculations use entirely different data sources they can and have diverged substantially. Fears were that the comparatively slow growth seen in the GDI data signaled underlying economic weakness that the GDP numbers weren't yet picking up. Those fears can be laid to rest, albeit partially—while the updated data has reduced the gap from 1.9% to 1.6% and both series now look stronger than before, a substantial discrepancy still remains as GDI continues to show weaker growth than GDP. However, the broad message from this new data remains positive, pointing to an economy with waning inflationary pressures and solid underlying growth.
America’s Investment Boom Was Even Stronger Than We Thought
The best news about the American economy comes on the investment side, with a large chunk of the upward revisions to GDP data coming from increases in real fixed investment, which was raised by more than 6.4% and saw its cumulative growth since early 2019 increase from 5.8% to 8.7%. That means the investment and construction boom we’ve seen over the last few years has actually been stronger than first reported—with manufacturing, housing, software, and power investments all being revised upward.
Firstly, America is building more housing—real residential fixed investment, the total amount of new housing construction and improvements to existing properties—has been revised up by 4.1% and has seen its high-mortgage-rate-induced decline since 2019 shrink from -5.1% to -2.7%. That’s thanks in large part to the massive increase in multifamily housing construction, which was revised upward by nearly 25% and has now grown by nearly 30% since the start of COVID. The multifamily construction boom is now officially the largest in nearly half a century, with current figures now showing the highest level of real multifamily fixed investment since the early 1970s.
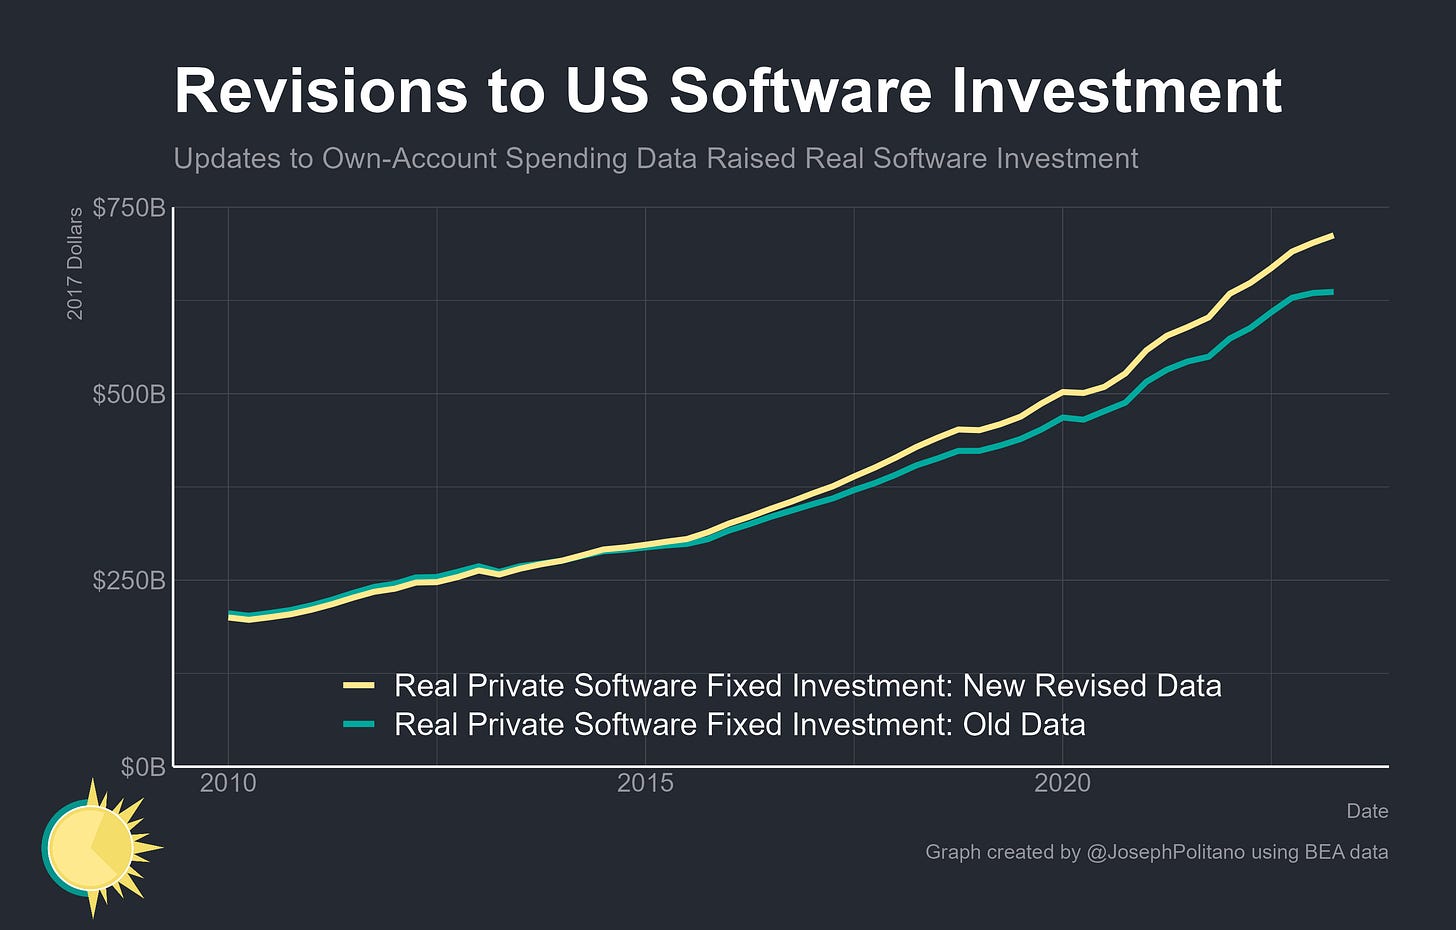
Yet the most important chunk of the upward revisions to American fixed investment has actually been on the nonresidential side, spread across a variety of key subcomponents. The first of which was software investments, a major sector (America spends more than 2.3% of GDP on new computer programs) that is notoriously difficult to measure and hard to adjust for inflation. The revisions to software data and methodologies, which included updates that now treat a portion of labor from an expanded pool of workers in various tech occupations as in-house investments, raised real private fixed software investment by 12%. This also spilled over into higher estimates of public-sector software investments, both inside and outside of the defense sector, and upward revisions to the real output of the US information industry.
However, the most critical change comes from updated numbers on America's ongoing manufacturing construction boom. Prior data had shown real investment in factories, fabricators, and other manufacturing structures soaring—but updated data shows current investments are even larger than that, reaching a staggering 45% above the pre-2023 modern high set in 2015. That primarily reflects the surge in investment for semiconductor facilities in the wake of the CHIPS Act, which has exceeded a $110B annualized rate of spending over the last few months. Yet it’s not the only part of America's industrial transition that official data understated and recently revised up.


