America's Record Wealth Boom
US Median Wealth Has Hit a Record High Propelled by Rising Home Prices, Growing Stock Ownership, and Pandemic-era Excess Savings
Thanks for reading! If you haven’t subscribed, please click the button below:
By subscribing you’ll join over 35,000 people who read Apricitas weekly!
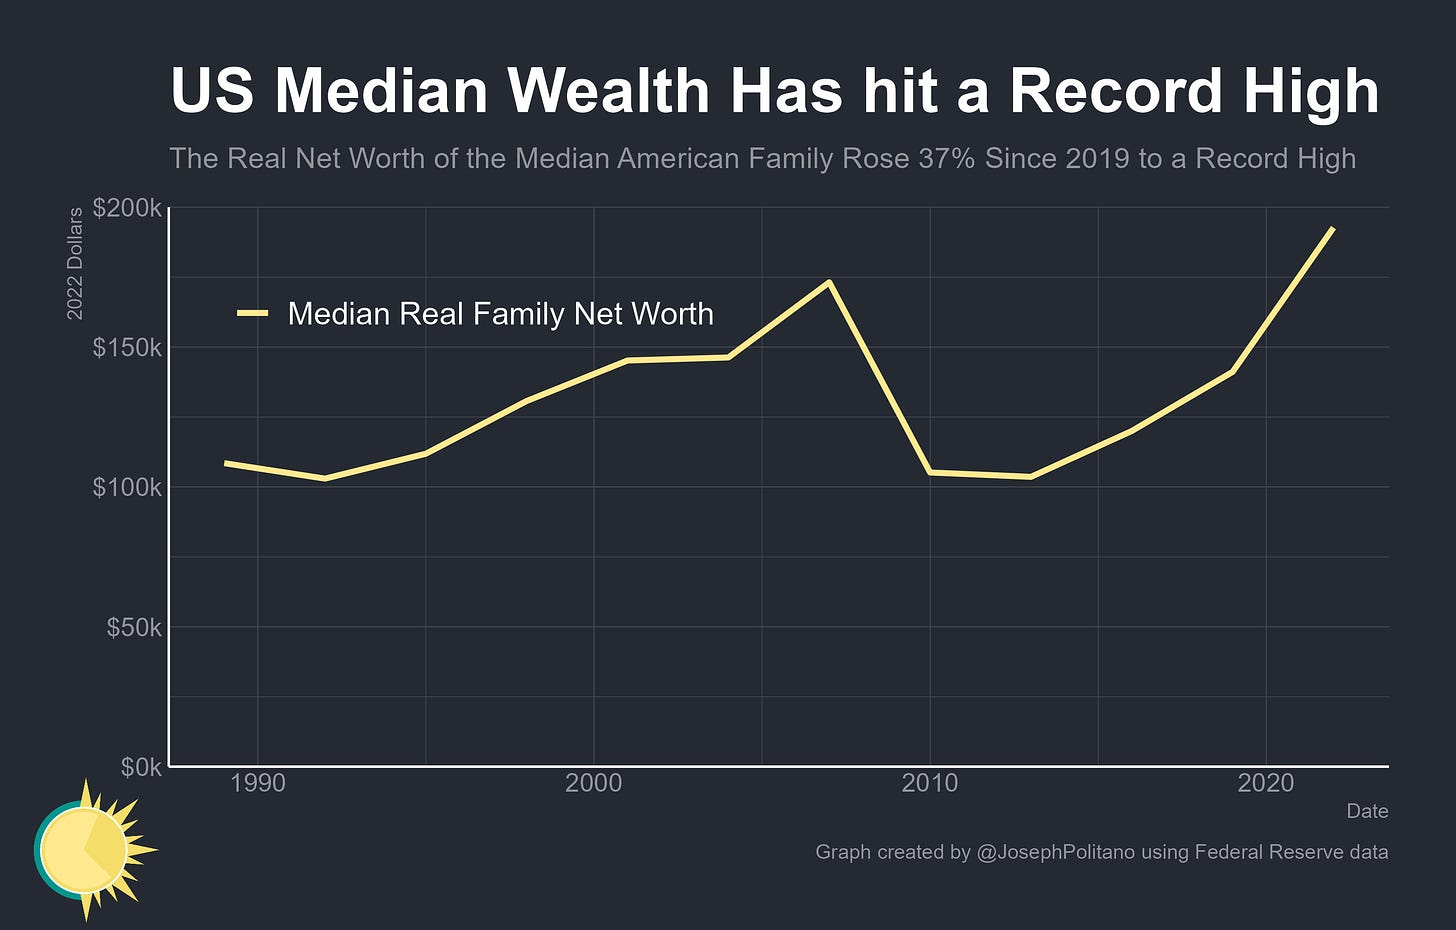
Middle-class Americans are richer than ever before, with real median US net worth rising a staggering 37% over the last three years and finally recovering from the 2008 recession. Wealth inequality, while still extremely high, fell to some of the lowest levels in the last decade, and real median net worth hit record highs for a variety of traditionally economically disadvantaged groups—including single parents, under-35s, renters, Hispanic Americans, Black Americans, and more. That’s what we learned last week when the Federal Reserve released the Survey of Consumer Finances (SCF), containing the single most comprehensive look at pandemic-era household balance sheets to date.
Measuring aggregate wealth is (relatively) easy; most debt and financial assets can be tracked through Wall Street institutions and teams of economists can produce accurate estimates for the valuation of housing, vehicles, and other physical capital. However, tracking the evolving distribution of wealth is extremely difficult—figuring out who got what loan and bought which assets is hard to do in the best of times, let alone throughout the tectonic shifts of a pandemic. Annual data collection efforts like the Fed’s Survey of Household Economics and Decisionmaking (SHED) can cover the general trends, but given the complexity of most households’ finances and the extremely high levels of wealth inequality in the US, more comprehensive measures are needed.
That’s where the SCF comes in—its advantage over every other data source is its extreme detail. The survey measures everything from the SNAP balances left on EBT cards to investments in tax-free government bond mutual funds to antique rug collections, and the median interview goes on for nearly two hours. The SCF also has a unique ability to measure the net worth of America’s wealthy elite—whereas other public surveys have to functionally give up on trying to measure the assets of the top 1% due to the complexity required, the SCF goes to extreme lengths to collect quality data on the super-rich, including surveying 21 literal billionaires last year. The disadvantage of this complexity is that the SCF only comes out every three years, with the last survey being conducted in 2019—but the 2022 data released just last week helps solve some key mysteries about today’s historic wealth boom.
Tracking Americans’ ‘Excess Savings’
At the start of the pandemic, Americans saved up trillions of dollars of wealth as lockdowns and COVID risks cut consumption while massive government support and the ensuing economic recovery boosted household incomes. They then spent down trillions of dollars of those “excess savings” in the reopening-fueled consumption rebound and ongoing surge in inflation that began in 2021. Earlier this year, it looked as though most of those savings were depleted, but recent revisions to GDP data revealed households had earned more than previously thought and were saving less than expected pre-pandemic, and thus “excess savings” were revised higher. Yet there are plenty of conceptual problems with this aggregate-level measure of excess savings, not least of which is that the data cannot answer fundamental questions about what form these savings take and who specifically owns them.
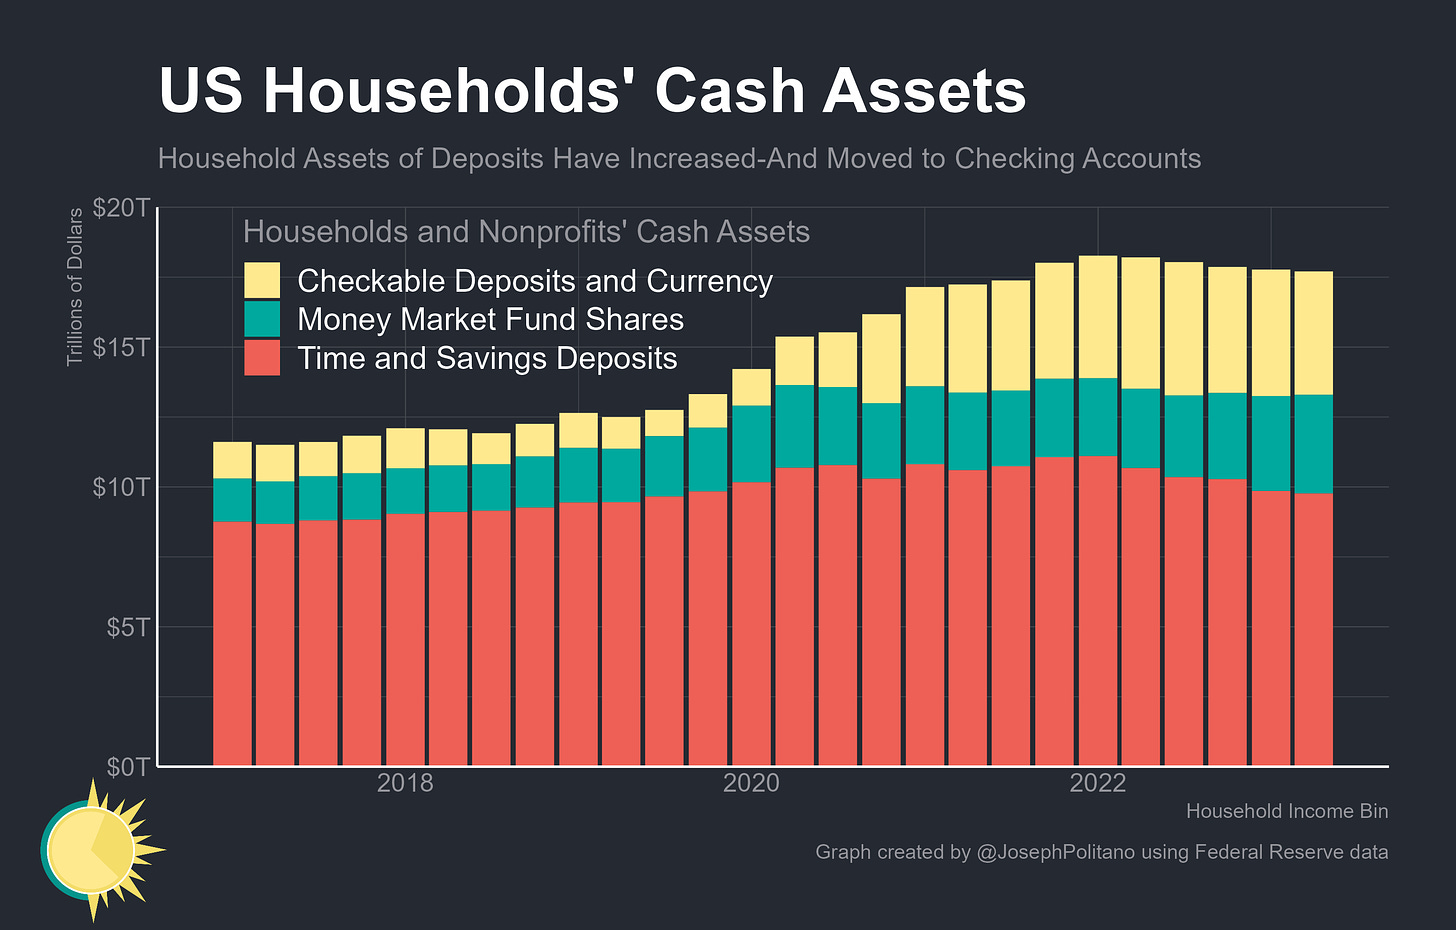
For example, look at the significant boom in household cash assets during the pandemic—it was hard to know how much of this reflected low-income households earning higher wages or saving their transfer payments versus how much of it reflected high-income households cutting back on consumption or saving their investment returns. Of course, it was always obvious that the bulk of excess savings would accrue to the wealthy simply because they earn more and save a higher share of their income, but pinning down the precise distribution of assets was still an important open question. Were middle-class Americans “out” of excess savings, or did they still have a cushion that could protect them from higher prices and enable stronger demand?
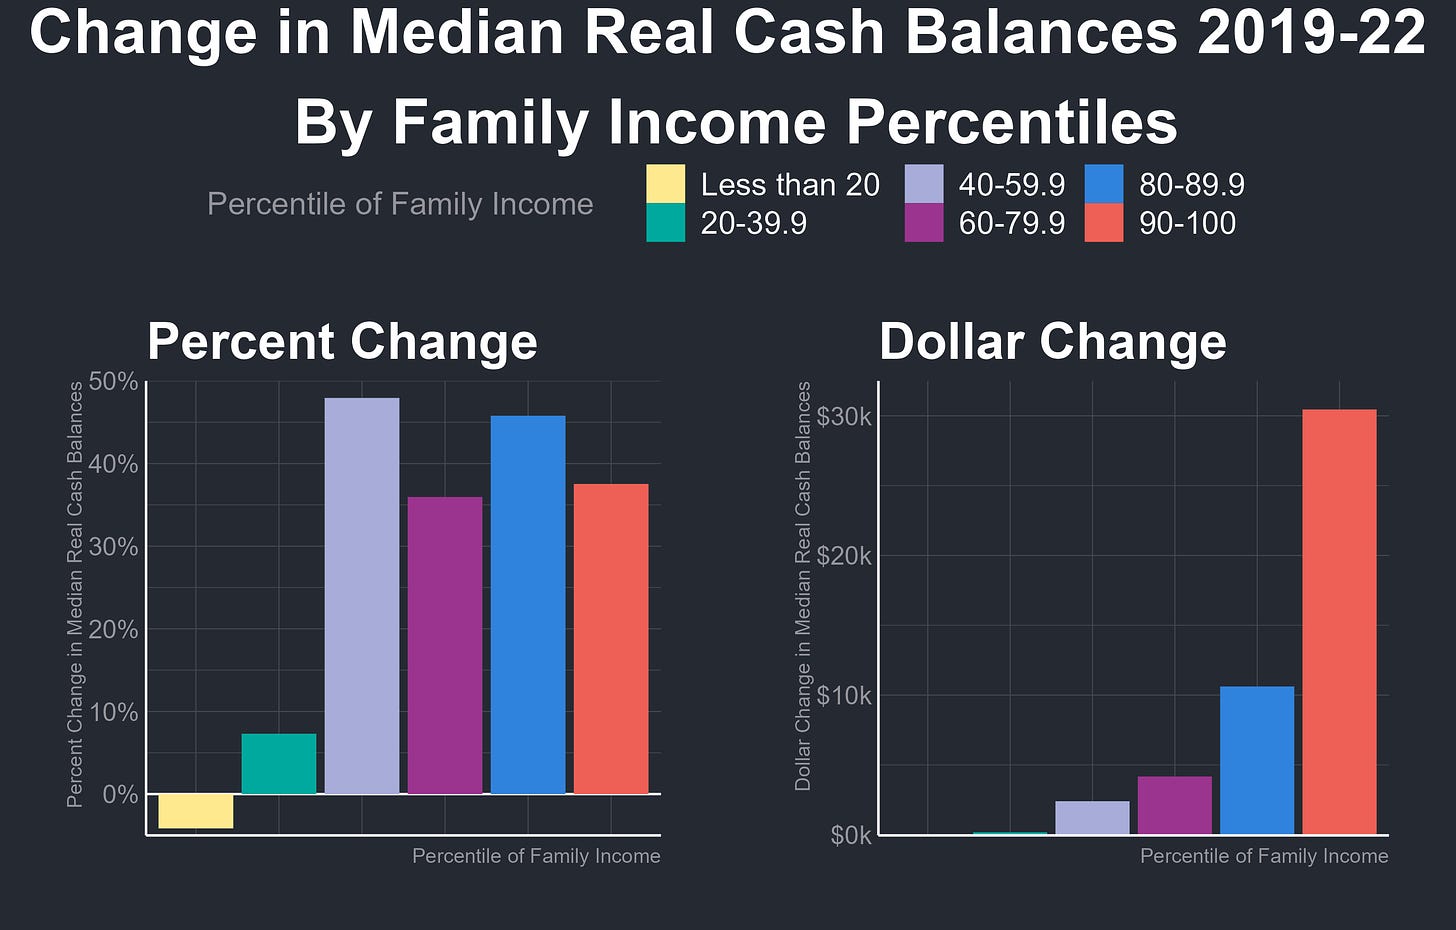
The good news is that the SCF data confirms most families still have some extra liquid savings—the median US family by income saw their cash balances rise more than 45% between 2019 and 2022, even after adjusting for inflation. Higher-income families saw their bank accounts grow by less percentage-wise, but that still means they made up the bulk of the rise in aggregate bank balances—the median member of the top 10% saw a $30k increase in real cash assets between 2019-2022 compared to an overall median increase of only $2k. Most worryingly, however, households in the bottom 40% of the income distribution have now depleted whatever boost in savings they got in the early pandemic, with real balances actually shrinking for the bottom 20%.
Likewise, most Americans were able to pay down some of their credit card debt during the pandemic, with the median real balance falling to the lowest level in the last 30 years. However, those in the bottom 20% of the income distribution were again the only ones to see a deterioration in their financial position as their real credit card balances increased by 10%. That number is actually even worse than it looks at first glance because more low-income households were relying on credit card debt in 2022—for the first time in the SCF’s history, a higher share of Americans in the bottom 20% of the income distribution were carrying credit card debt than those in the top 10%.
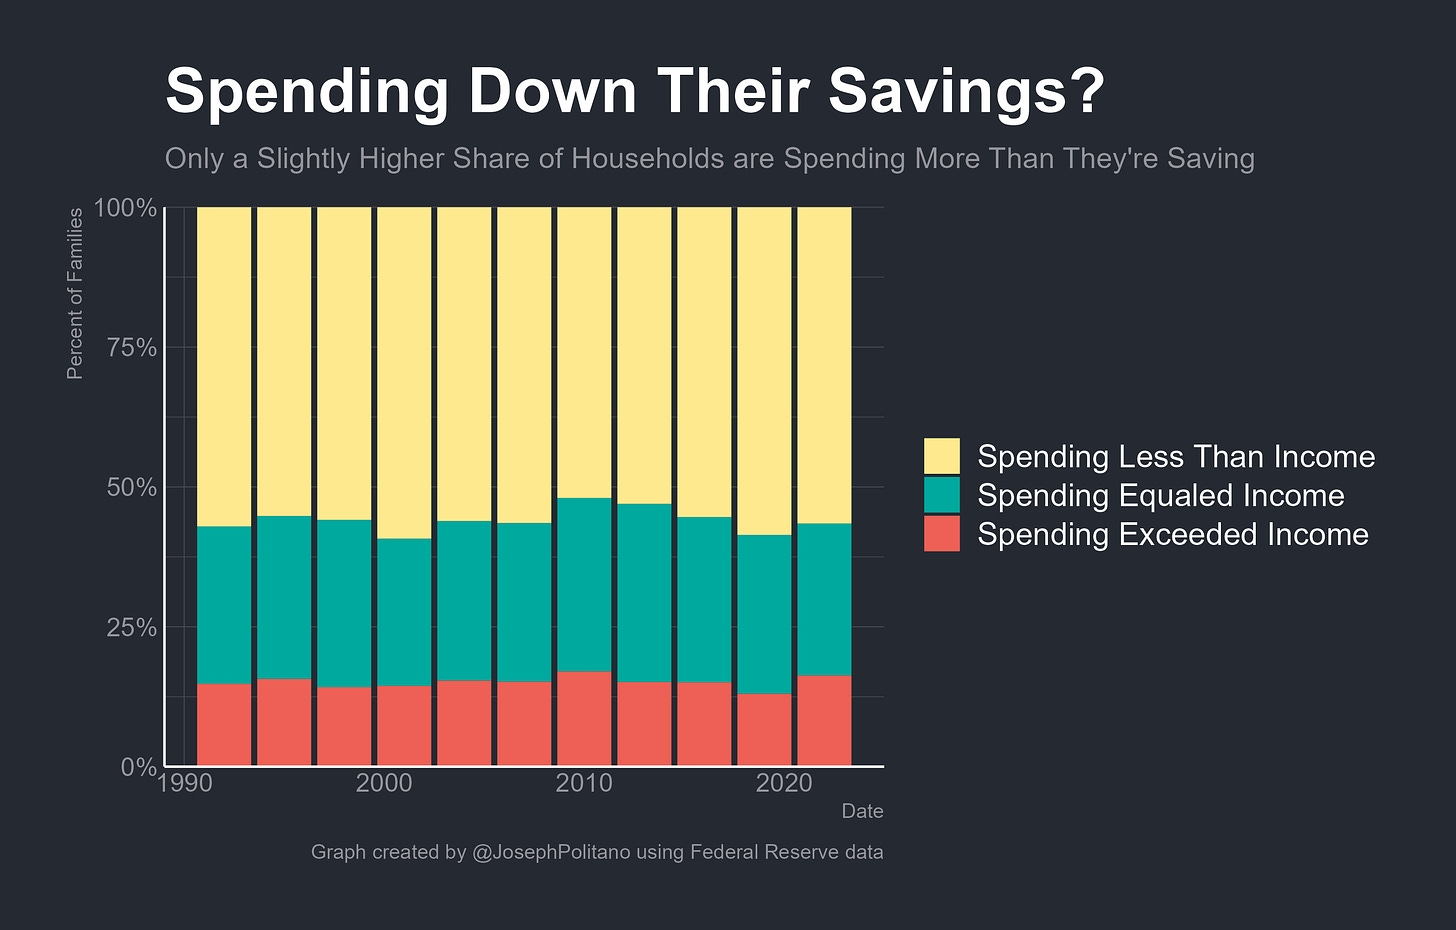
Yet those signs of financial stress, while acute, did not affect the majority of the population—while the share of families spending more than their income rose to levels not seen outside the depths of the Great Recession, the share spending less than their income also remained relatively high by modern standards.
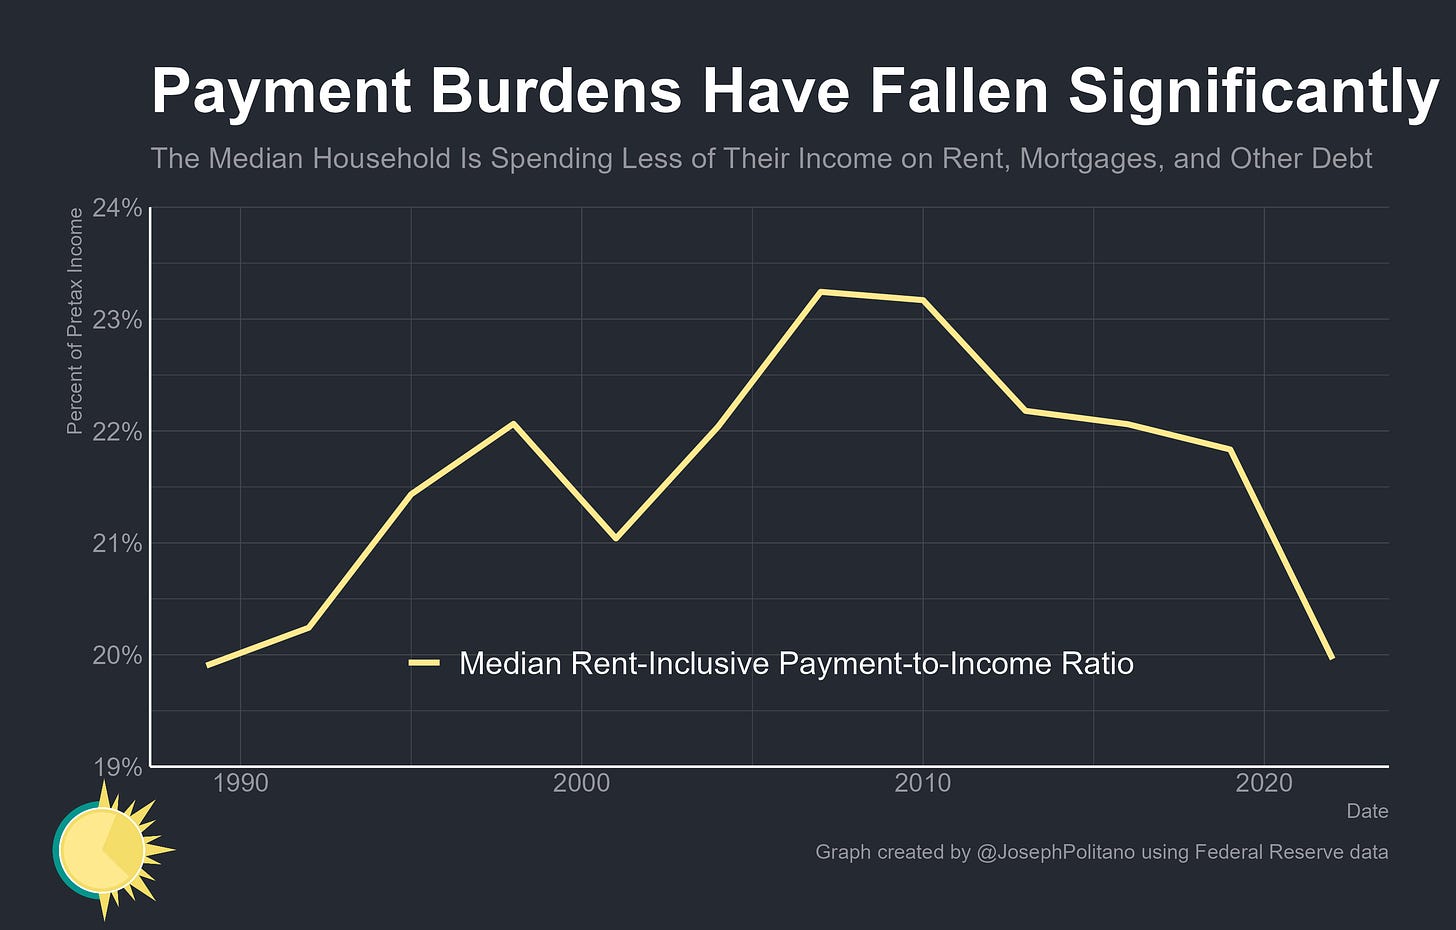
Indeed, while necessary expenses have risen for those with low incomes, for middle-class Americans household payment burdens were at the lowest levels in 30 years. The median rent-inclusive payment-to-income ratio—which includes servicing costs for mortgages, car loans, student loans, and all other consumer credit alongside required payments on rent and vehicle leases—fell just below 20% for the first time since the 1990s. That’s thanks in large part to rising incomes, increases in excess savings, suspension of student loan payments, and perhaps most importantly, the fact that many homeowners were able to refinance their mortgages.
Tracking the Housing Boom
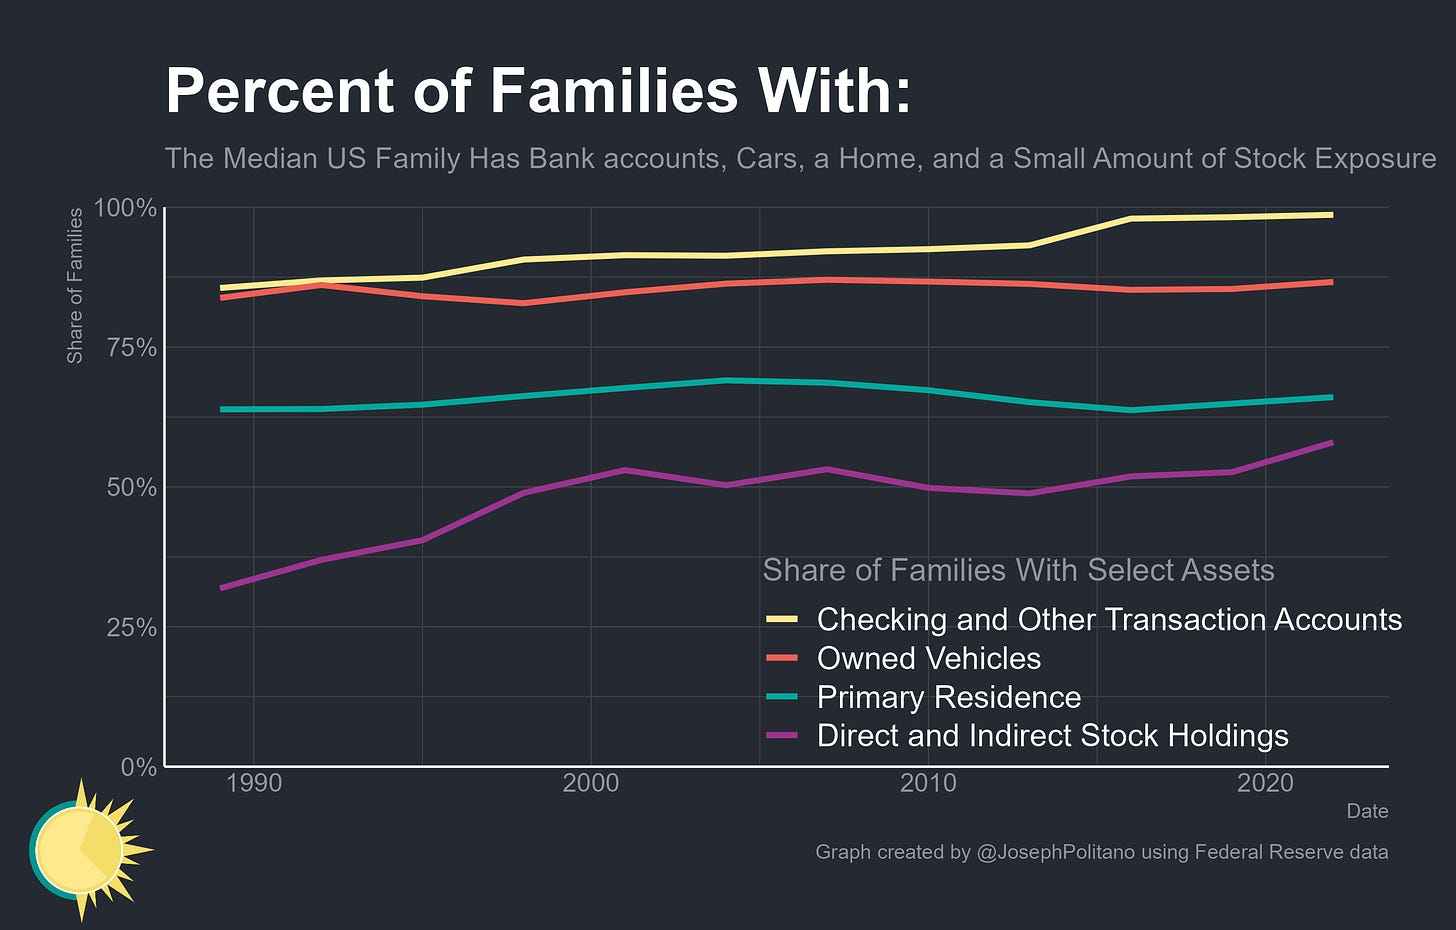
Indeed, it’s worth remembering that the bulk of the median American’s balance sheet is in their home and its attendant mortgage—supplemented with bank accounts, a car or two, and some small exposure to the stock market usually through retirement accounts. It should thus not be too surprising that median net worth has increased so much since 2019: the stock market is up, cars are more expensive, government fiscal aid boosted bank balances, and most importantly home prices have risen significantly.
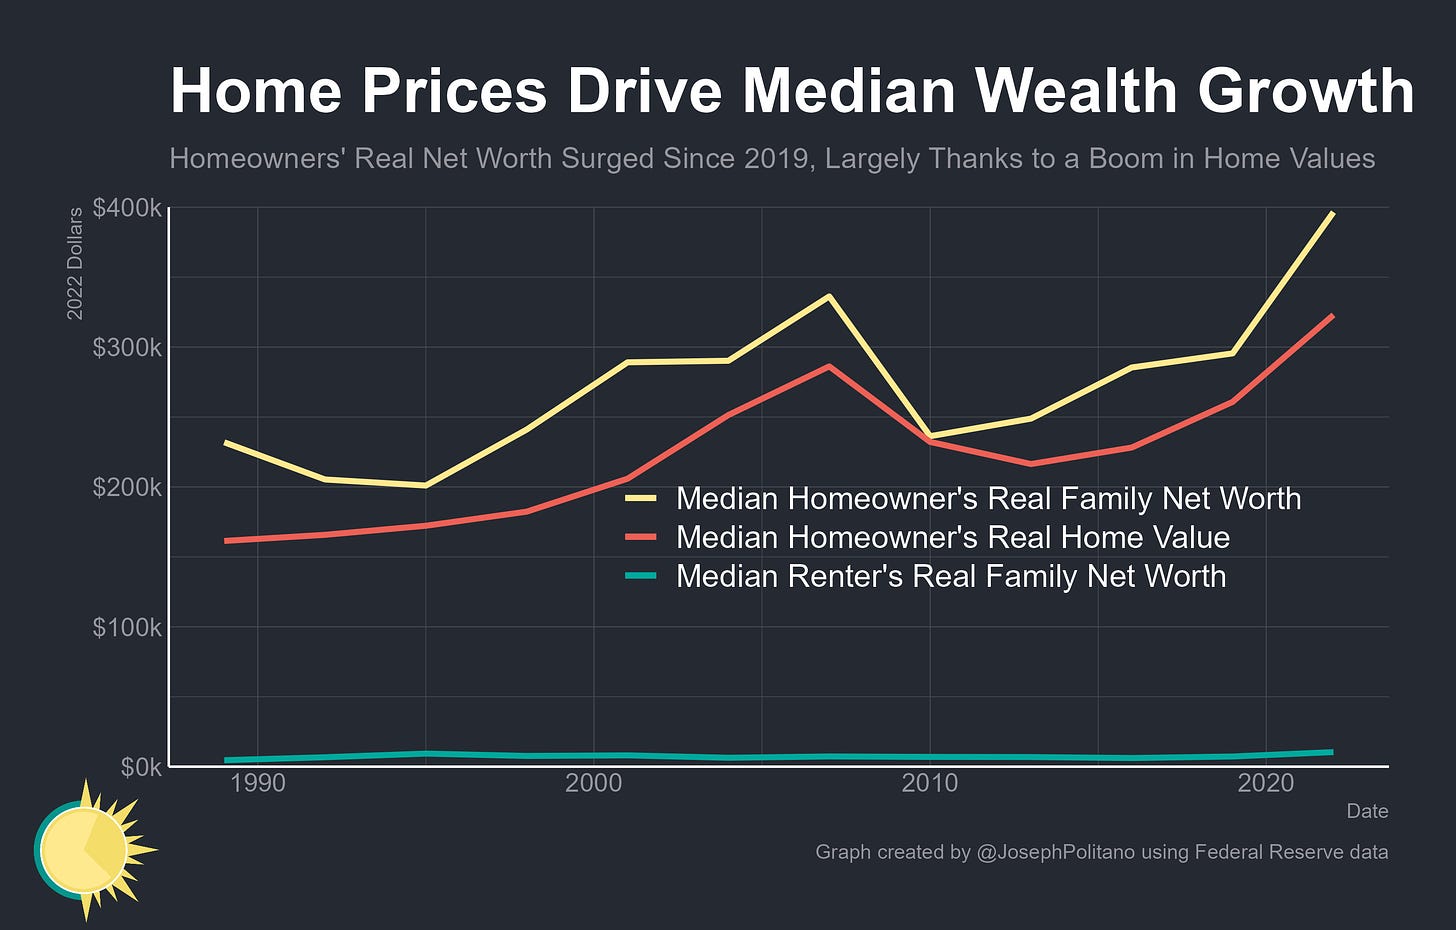
Yet it is actually hard to oversell just how central the housing market has been to rising middle-class wealth—the median renter saw their real net worth increase by about $3.1k since 2019 while the median homeowner saw their real net worth increase by $101k, of which $63k came directly from home price appreciation. The fall in mortgage rates in 2020/2021 coupled with the inflationary boom of 2021 onwards was the perfect recipe for boosting wealth amongst American homeowners—housing prices skyrocketed, most households with mortgages were able to refinance for a lower interest rate, and inflation ate away at the real value of mortgage debt.
A microcosm of similar dynamics occurred for owned vehicles—the downturn in car production caused the median American’s vehicles to shoot up in value from $19k to $28k while also reducing the real cost of outstanding car loans. However, few normal people would characterize this as a meaningful increase in wealth that could easily be converted into higher consumption or elevated quality of life—they are more likely to see the increase in vehicle prices as a drop in affordability and deterioration in their quality of life. Understandably, many (especially those who don’t own their homes) will experience the rise in real estate wealth in the same way.
Indeed, the ratio of median home value to median household income has surged to the highest levels in the SCF’s history as the effects of nationwide housing shortages hurt affordability. The boom in housing wealth is real and an important driver of strengthening balance sheets—a counterfactual world in which low employment levels and a sluggish recovery caused real home prices to decline is certainly not one where Americans are better off—but it also reflects some of the structural dysfunction in the housing market.
Tracking the Stock and Business Boom
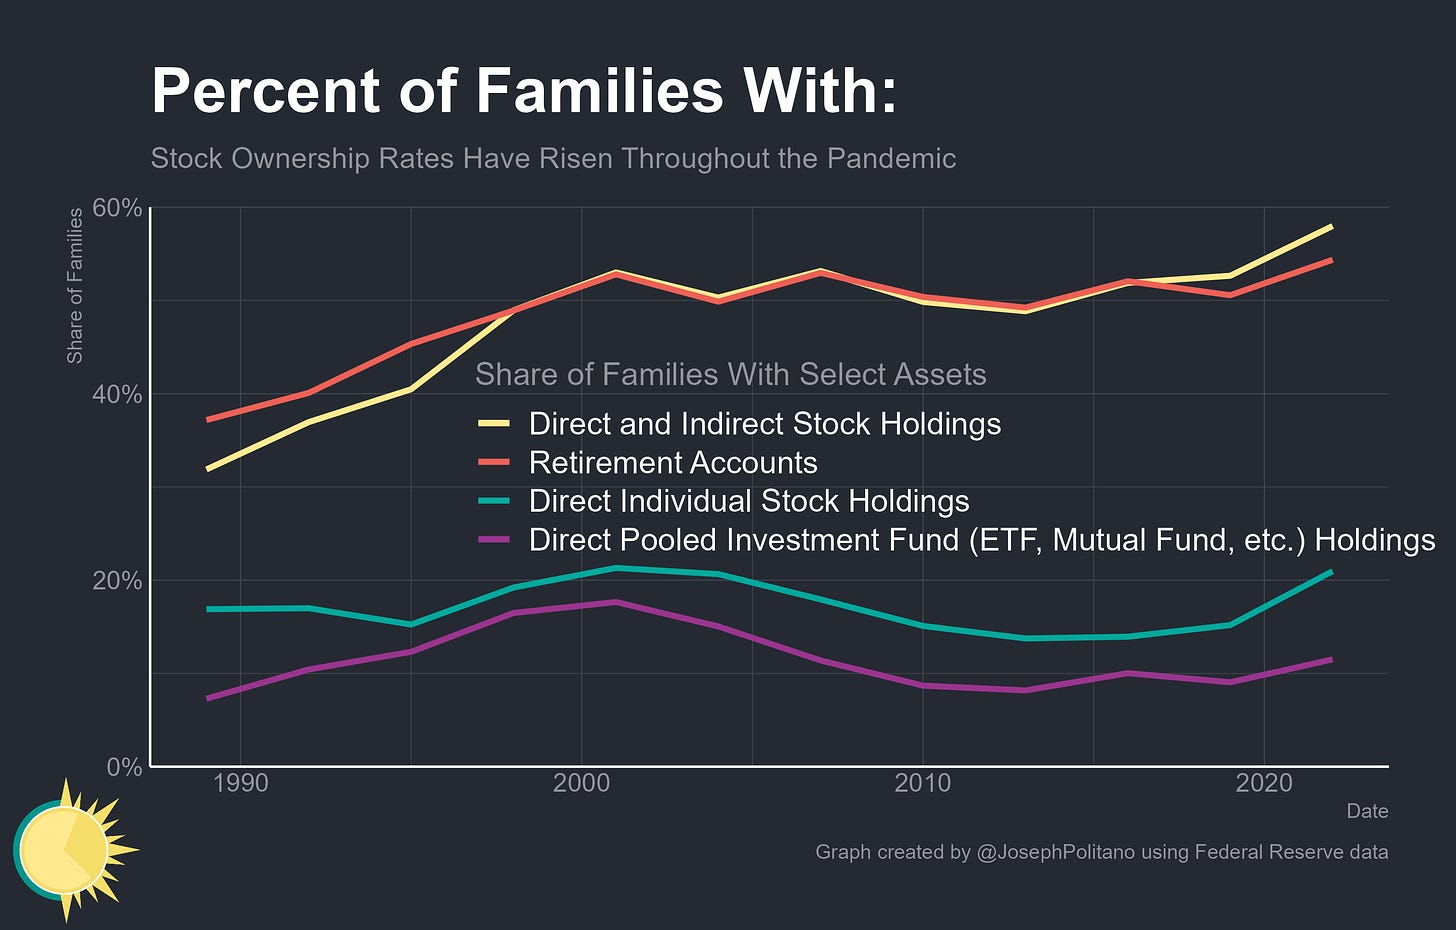
While nowhere near as big a story as the housing boom, rising household involvement in financial markets has also been a significant shift seen throughout the pandemic. 58% of families now have some part of their net worth tied to the stock market, the highest on record, and the median household with any stock assets now has about $52k. The vast majority of families with stock investments hold them in retirement accounts like 401(k)s or IRAs, ownership of which reached 54% of families and the median value hit a record high of about $87k.
The even flashier story has been the rise in retail investing and day trading throughout the pandemic, which is now starting to show up in metrics of household wealth. The share of American families with direct ownership of stock—that is, they hold individual names like Apple or Microsoft outside of retirement accounts—is closing in on the record highs set at the turn of the millennium. That push is strongest among young Americans and those who traditionally did not participate in markets—direct stock ownership has hit record highs among under-35s, renters, Black Americans, and Hispanic Americans.
Americans are also increasingly taking a more active role in their portfolios—the average family with individual stock holdings now spreads those investments across more than 10 companies, and the median number of trades placed also rose to the highest levels on record. However, the amount invested in directly held individual stocks is still mostly trivial compared to the more common types of index funds and retirement assets—the median value of families’ directly held stock portfolios fell to $15k thanks to a surge in interest among investors who only trade with a couple thousand dollars.
The other big story of the pandemic has been the massive rise in small business formation and self-employment activities whether as a primary or secondary income, and that boom also showed up in the SCF data. More than one in seven households now have some kind of direct business ownership, a record high, and the surge seen during the pandemic was once again concentrated among Black, Hispanic, younger, and renter households. That surge in business formation and self-employment resulted in more volatility in families’ earnings but was also an important part of ameliorating wealth and income inequality.
Wealth Inequality is Falling but Remains High
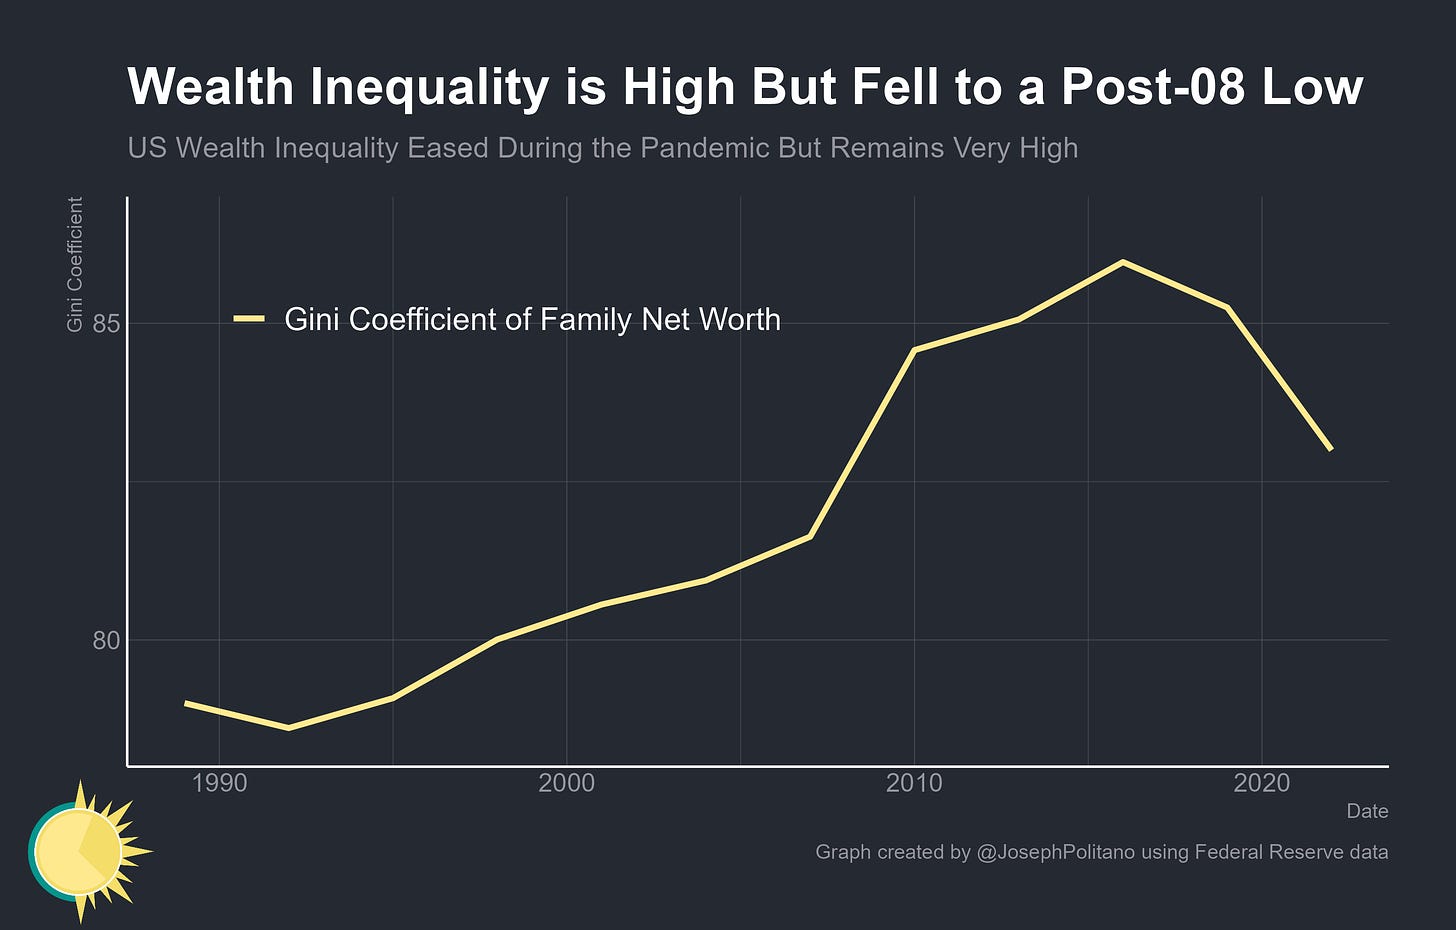
Indeed, the SCF shows that the pandemic era has seen a rather significant drop in US wealth inequality in contrast to the rising multi-decade trend of rising inequality (although these figures don’t include the very richest Americans like Elon Musk or Jeff Bezos). This drop in wealth inequality should fundamentally not be too surprising—economic growth has been strong, assets held by the middle class (primarily residential real estate) rose faster than average, and debt burdens have eased—but it is still significant.
Yet the more things change, the more they stay the same—and the fundamental state of American wealth inequality has not been reshaped by the pandemic. The US is now just dividing what is thankfully a much larger pot of wealth somewhat more evenly—which is still a massive improvement over much of the 2010s when a smaller pot of wealth ended up in fewer hands.


