America's Shrinking Pile of Savings
People are Quickly Spending Down the Excess Savings From the Early Pandemic
Thanks for reading! If you haven’t subscribed, please click the button below:
By subscribing you’ll join over 15,000 people who read Apricitas weekly!
Otherwise, liking or sharing is the best way to support my work. Thank you!
At the onset of the pandemic, governments in high-income nations around the world disgorged trillions of dollars in fiscal stimulus to households in the form of furlough payments, unemployment benefits, and stimulus checks. Workers who retained their jobs safeguarded much larger shares of their income. Consumers—largely unable and unwilling to spend all of their usual and new sources of income—therefore saved trillions of dollars more than expected in 2020 and 2021.
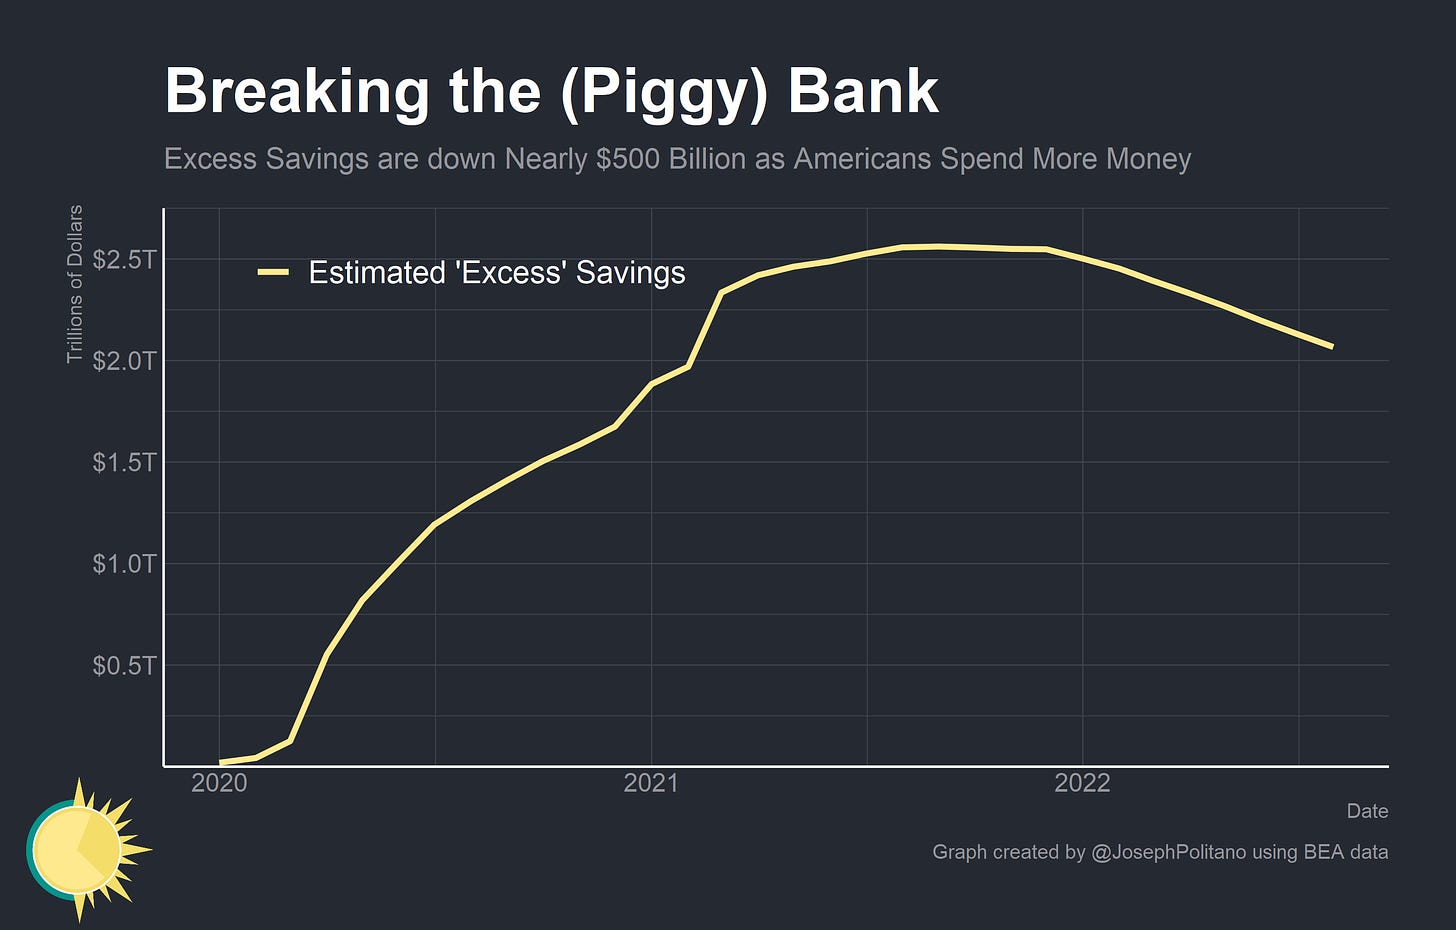
Since the initial shock wore off, spending has recovered—powered in part by the extra savings that consumers accumulated in the early pandemic. Now, Americans’ ‘excess’ savings are declining rapidly—though significant amounts still remain. How long those savings last will help play a critical role in determining the persistence of today’s high inflation.
Excess Savings and Rising Spending
First, what are excess savings? Most definitions originate from the personal savings aggregates in America’s National Income and Product Accounts. Personal income is designed to represent the total flow of wages, benefits, and dividends to households while personal outlays represent the total flow of consumption, interest, and transfer payments from households. The remaining number is personal saving—simply the share of income that is not spent. Those savings can manifest as cash, 401(k) contributions, cryptocurrency, or even residential improvements. Excess savings are simply the cumulative amount of saving above and beyond what would have been expected in a world without the pandemic.
However, precisely defining excess savings is somewhat of a judgment call since it requires precisely defining a counterfactual “normal” amount of savings. I choose to calculate excess savings as simply the cumulative above-trend disposable income plus cumulative below-trend personal outlays—but different assumptions can yield different estimates (such as extrapolating a trend or level in saving itself instead of income and spending). Nevertheless, the pattern is clear: households experienced a large increase in aggregate income during 2020/2021 and a large decrease in aggregate spending in 2021/2022. By mid-2021 aggregate spending shot above trend and by 2022 excess savings began to dwindle. In fact, recent revisions have only strengthened the spending data for 2021/2022—making updated estimates show even faster declines in excess savings.
The end result is that excess savings are now basically $500B below their 2021 peak and still rapidly declining. If current trends continue, consumers will spend down more excess savings in 2022 than they accumulated in all of 2021. That drop in excess savings is likely enabling large chunks of the rapid inflation we are seeing this year.
But—as I have written about before—excess savings as narrowly defined by the National Income and Product Accounts misses plenty of critical nuances. That data is important—but fundamentally it is an aggregate that does not delve into the distribution, composition, and location of excess savings. Getting to the heart of what matters for excess savings—the degree to which they will affect spending and inflation—requires digging into the nuances of how they’re getting spent down.
Why Are Excess Savings Supposed to Matter?
Fundamentally, the important parts of excess savings are threefold:
What is the increase in the nominal net worth of households?
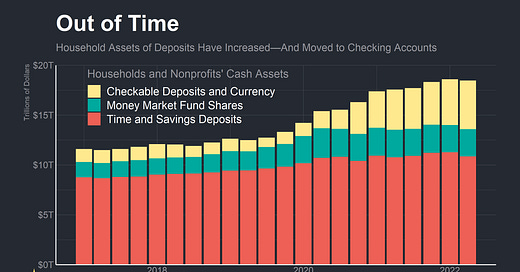
What is the shift in the distribution of household assets towards more liquid items (which, at present, mostly means cash)?
What is the shift in the distribution of household assets towards households who were previously liquidity constrained or had higher marginal propensities to consume out of wealth?
Defining ‘excess savings’ as simply the cumulative above-trend disposable household income and cumulative below-trend household spending does a rather poor job of measuring these truly important parts of excess savings. For example, US personal income data doesn’t include capital gains as income but does include capital gains taxes against income. Realized capital gains are defined as a change in wealth, not income—but taxes are a change in income, not wealth—even though a robust conceptualization of excess savings would almost certainly include ‘extra’ capital gains net of taxes. Plus, aggregate savings data makes no distinction between 401(k) contributions, home remodeling, or extra cash in a checking account—they are all savings, even though they have radically different implications for the path forward for inflation.
Keep reading with a 7-day free trial
Subscribe to Apricitas Economics to keep reading this post and get 7 days of free access to the full post archives.


