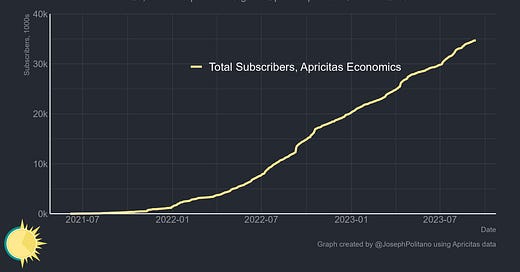
Just over one year ago, I took a leap and quit my job to start writing this newsletter full-time. At launch, I was trying as hard as possible to temper my expectations—media is an almost impossible business, one in which I have watched many people much smarter than me struggle to build a sustainable independent career. In preparing to go full-time, I presumed that this venture would make very little to start with and that I would have to subsist on whatever I had saved up from my previous 9-to-5 jobs for a long while before I could hope to make something approaching a stable income.
I’m happy to report that I was extremely wrong—and that the success of this newsletter has vastly exceeded my initial expectations. Since last year, more than 20,000 new people have subscribed to Apricitas, almost tripling readership and allowing me to turn what started as a personal hobby into a full-fledged career.
For me, the fact that this newsletter has been able to thrive amidst an extremely difficult environment for the broader news industry is a vindication of the model and philosophy I built Apricitas on. In my launch post, I said that “in the modern world, news is cheap, but analysis is more valuable than ever before,” and that my goal was to deliver the kind of detailed data and information you weren’t going to be able to find in traditional newspapers. In particular, there is a fundamental tension in data journalism between data—which demands careful and thorough analysis—and journalism—which demands rapid publication of news-cycle-chasing pieces—and I sought to build a home squarely on the data side. Thanks to your support, over the last year I have been able to deliver that kind of careful and thorough analysis via 95 in-depth data-driven articles on a variety of topics, including:
The Death of Silicon Valley Bank, Signature Bank, First Republic, and Credit Suisse in the Banking Crisis of early 2023, alongside coverage of the Federal Reserve’s efforts to rescue the financial system through new emergency lending facilities and how the banking system changed in the wake of the crisis.
The slowing of global inflation, via both supply and demand factors, including special analyses on disinflation in rent and car prices
Growing optimism about the possibility of a soft landing in the US as the drivers of inflation fade while America’s labor market remains strong (though weakening).
The changing US-China trade relationship, including the return of US industrial policy, America’s growing semiconductor trade war with China, and China’s rapid emergence as a car export powerhouse.
The ongoing effects of the invasion of Ukraine, Russia’s adaptation to international sanctions, and the economics of global military rearmament efforts
How higher mortgage rates caused a credit crunch in the housing market, how the housing market has stabilized despite that credit crunch, and why those high mortgage rates haven’t (totally) frozen the housing market.
Why ChatGPT will disrupt labor markets for the better, the drivers of 2022/2023’s Techcession, and how that Techcession ended without net job losses.
Europe's fragile recovery, including special coverage of Germany’s industrial slowdown and the UK’s economic weakness.
Your support has validated the large amount of work that goes into each of those pieces—and I hope you will continue reading and enjoying the newsletter in the years to come.
Next Year—Making Apricitas Work Better
“Learning by doing” is one of the most important yet underappreciated ideas in economics—workers, managers, offices, firms, institutions, and even countries gain skills via gradual refinement as they continually perform similar tasks. Productivity, in other words, is gained through practice and the steady accumulation of 1,000 minor improvements.
When I went full-time, I tried to take that idea to heart in the work of this newsletter—my goal was to build the foundations that would make Apricitas’ production processes more efficient and its output more expansive going forward. You might have noticed that articles from the last twelve months contained my first pieces that analyzed large-scale financial data, geographic data, and national data from more than 10 new countries (plus the EU). All of those were deliberate choices to expand my breadth of coverage and build out experience doing different kinds of data analysis, working with different types of data, and integrating data sources from countries outside America. In a more literal sense, this work also builds up “fixed capital” of code that I can utilize going forward—some of my charts are whipped up in 15 minutes, while others legitimately take 10-20 hours to construct, but once made they are always much easier to update and analyze going forward.
My goal this year is to continue that deliberate growth, but also to enjoy some of the fruits of labor that were planted last year. In an ideal world, that should mean further increases in topic breadth, article depth, and the ever-elusive post frequency. Right now, I have over 200 pieces at some level of the drafting process—and I am so excited to share them with you over the next year.


Well done! I just subscribed and I can’t wait to catch up on all these articles. Would you mind sharing which tool you use to make your charts?
congrats joey! what a ride.