How Rate Hikes are Affecting the Economy
Through Wages, Investment, Employment, Output, and More
Thanks for reading! If you haven’t subscribed, please click the button below:
By subscribing you’ll join over 17,000 people who read Apricitas weekly!
Otherwise, liking or sharing is the best way to support my work. Thank you!
The Federal Reserve is raising interest rates in an attempt to combat high inflation—and has been for more than six months now. In fact, the first tightening of monetary policy began even earlier—at the start of 2022, nearly a year ago at this point. And yet, inflation remains high—so where are these rate hikes turning up?
As new official data is released, we are starting to see rate hikes filter through to wages, investment, employment, output, and more. The famously long and variable lags between monetary policy and inflation mean that it’s hard to tell precisely when that will manifest as reduced price growth—but there are now at least some signs of inflation deceleration in the future.
Weaker Labor Markets?
Yesterday, new data from the Employment Cost Index (ECI) showed a decrease in year-on-year private-sector wage growth for the first time in two years and a notable deceleration in quarter-on-quarter growth. That’s important because the ECI is arguably the most robust measure of wages in America—unlike average hourly earnings measurements from the business establishment survey or wage growth measurements from repeat surveys of households in the Current Population Survey (CPS), the ECI goes to great lengths to control for occupation and industry in constructing its data.
In other words, ECI asks “how much did the cost to employ someone change?” whereas average hourly earnings asks “what’s the change in the mean wage of everybody who has a job” and CPS asks “what’s the average change in wage for workers since this time last year?1” The ECI is also more methodologically robust than most of the other wage metrics—which is why hot ECI readings were a large part of what drove Jerome Powell’s pivot away from the “transitory inflation” narrative of 2021.
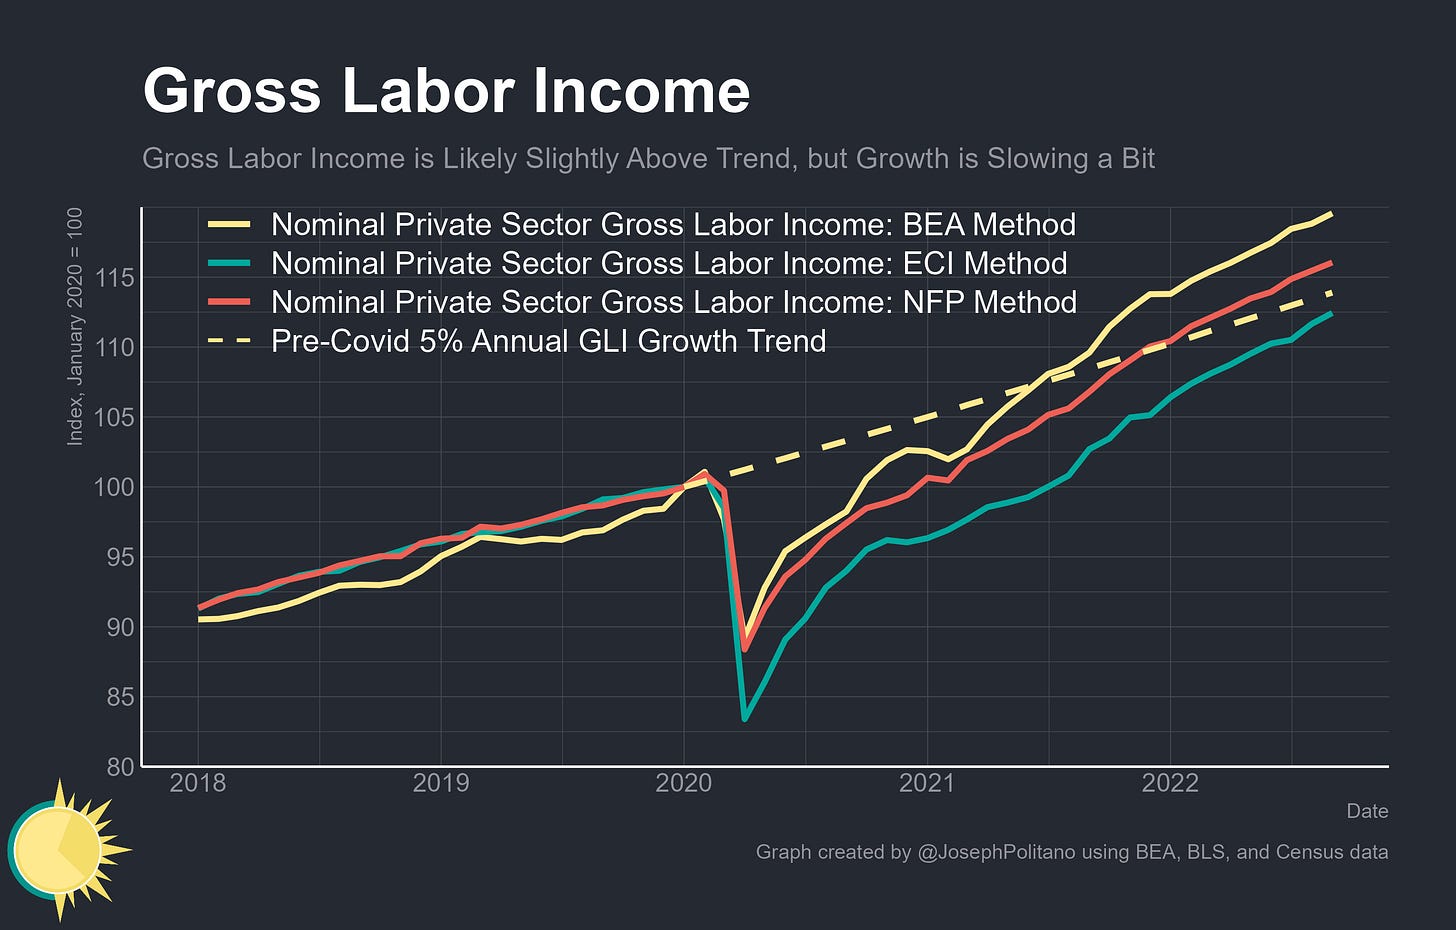
With the new ECI data we can thoroughly examine growth in Gross Labor Income (GLI, the sum of all wages and salaries paid to all workers in the economy). Here, three different sources tell similar stories—the Bureau of Economic Analysis’ measure (which is based on comprehensive administrative data, except for extrapolations used for the most recent months), ECI measure (which is calculated by multiplying household private-sector employment data by ECI private sector wages and salaries), and non-farm payrolls measure (which comes directly from the Bureau of Labor Statistics’ establishment survey) all show Gross Labor Income catching up or exceeding the pre-COVID trend2 but noticeably slowing down in the last few months. That slowdown still leaves most measures of GLI growth above pre-pandemic averages but should assuage some fears of wage-price spirals and highly entrenched inflation.
We have also seen a significant drop in the quits rate this year—which is important since quits represent a proxy for future wage growth. From their peak of 3% at the end of 2021, the quits rate has fallen to 2.7% in the most recent data (for the month of August). Job openings—though they by no means the most robust data series and should be taken with a grain of salt—have also fallen by nearly two million. Regardless of their relative merit in forecasting, the Federal Reserve is looking to see both quits and openings come down as part of their fight against inflation.
Slower Spending Growth
Part of why the Fed is so focused on wages is that aggregate spending growth has tracked gross labor income rather closely throughout 2021/2022 despite the massive influx of cash from federal stimulus programs—something Matt Klein has pointed out several times. Obviously, this is just an aggregate relationship and not something that necessarily bears out at a micro level—many low-income households have “spent down” much of the money they got from unemployment benefits, stimulus checks, and other pandemic recovery programs—but it is true that spending growth has slowed alongside wage growth over the last couple quarters. The third quarter’s personal spending growth was arguably the first time since late 2020 that we saw something close to “normal.”
But it is also true that rising rates have helped trim down Americans’ net worth and ‘excess’ savings, further weighing on their ability to spend and adding another possible headwind to inflation. Aggregate personal spending growth is outpacing aggregate personal income growth, and the value of households’ financial assets has also fallen.
Indeed, real consumption growth has contributed an unusually small amount to real GDP growth since the start of this year. Part of this is definitely a result of energy price spikes and supply chain issues stemming from the pandemic and war in Ukraine, but part of it is the effects of monetary tightening filtering through to spending and real consumption growth. And when consumption sneezes, investment gets a cold.
Lower Investment
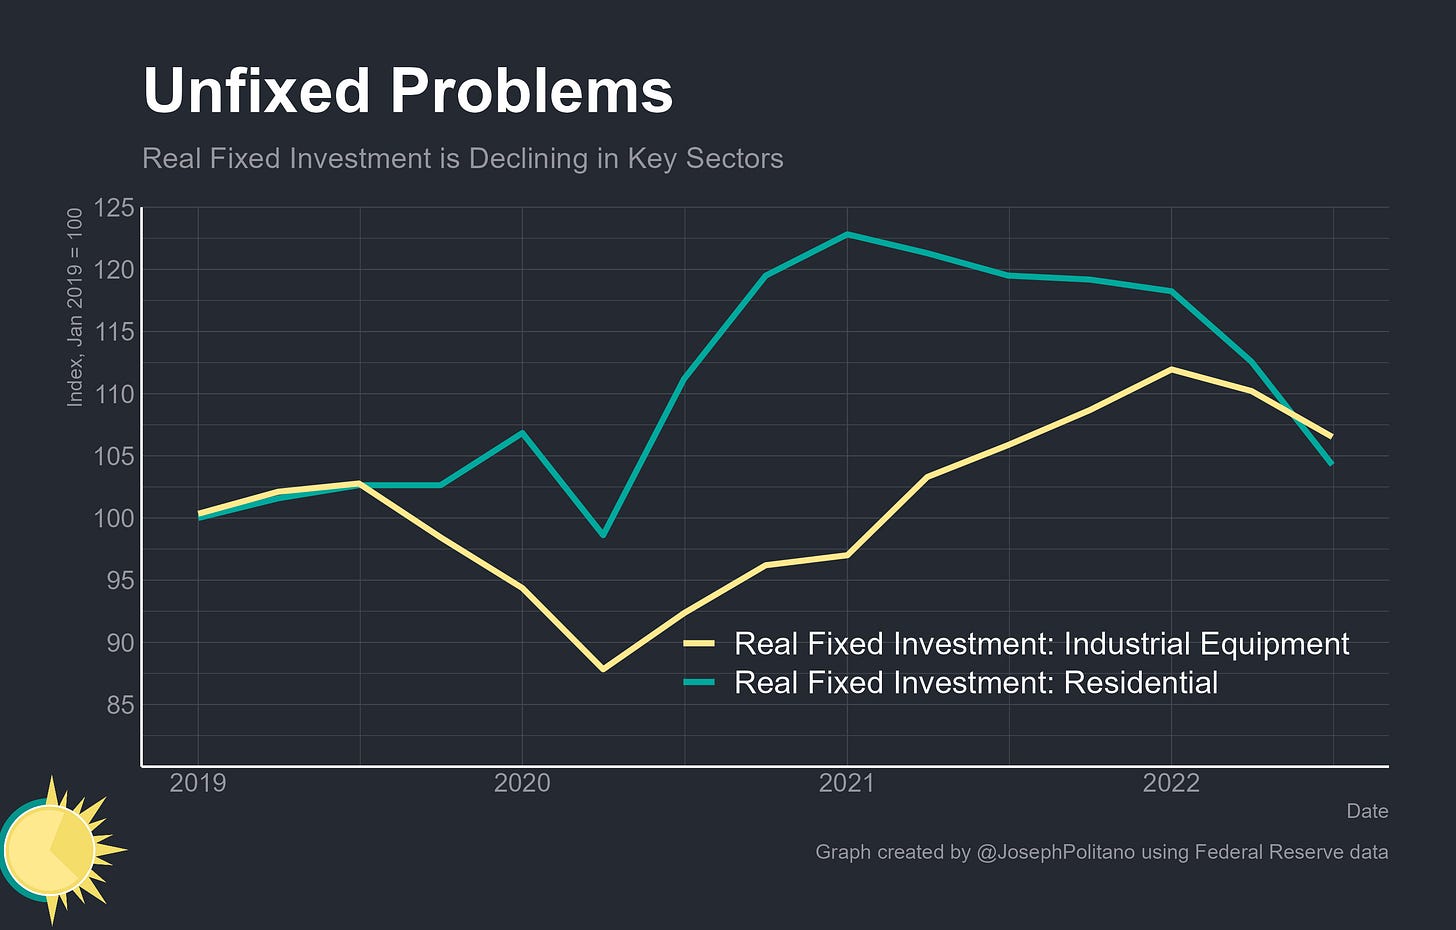
Rising interest rates, tightening monetary policy, and cooling demand are already having an even more substantial impact on investment. Key sectors like housing and manufacturing have seen large falls in real fixed investment since the start of the year—residential fixed investment in particular has given up essentially all of its post-pandemic gains.
That’s partly because single-family housing starts have been battered by the rapid rise in mortgage rates, falling all the way back to early 2020 levels. With mortgage rates crossing above 7% this month, it’s possible that the future could bring even more pain for residential fixed investment.
Conclusions
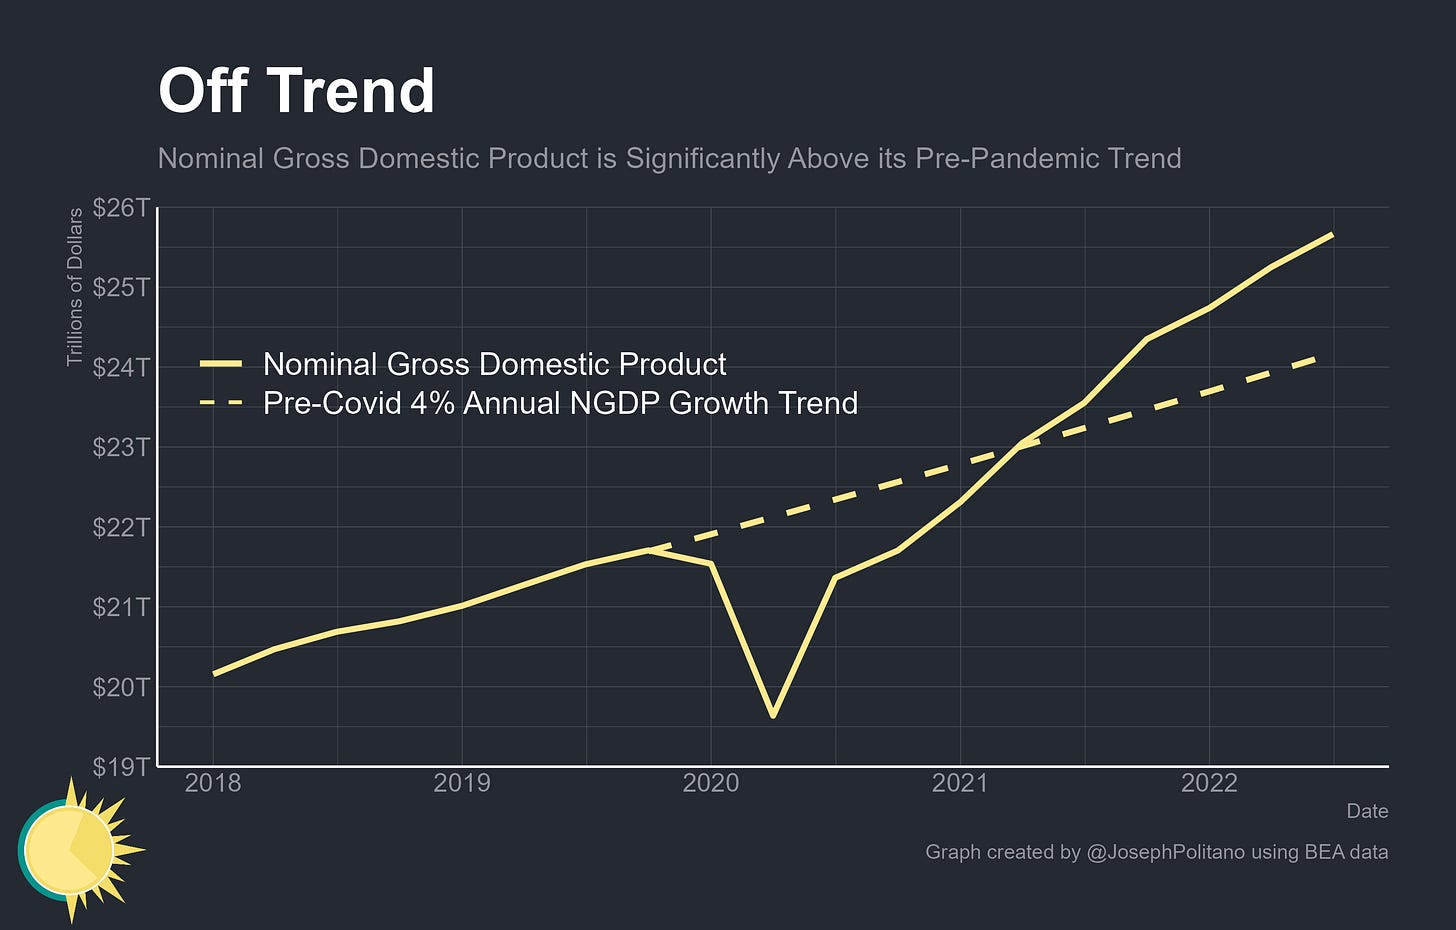
Fundamentally, nominal spending growth is above-trend and still growing at a rapid pace. Nominal GDP growth has significantly exceeded its pre-pandemic trend and grew at a 6.7% annualized rate in Q3. That’s lower than the 9.5% growth experienced from Q2 2021 to Q2 2022, but it’s still too high for comfort—it would be more consistent with ~3.5-4.5% long-run inflation than the 8% we have now, but that’s still significantly higher than the Fed’s 2% target.
Meanwhile, we are already experiencing the real economic slowdown that Federal Reserve officials believe is necessary to control inflation. Real Final Sales to Private Domestic Purchasers—a niche data series that sums together real consumption and real private fixed investment—has registered essentially zero growth over the last two quarters. Negative growth in Real Final Sales to Private Domestic Purchasers is something that almost always occurs during a recession, underscoring how fragile the economy remains amidst rising rates.
The actual data construction isn’t this simple (here’s a thread with more information if you’re interested) but it still is fundamentally a survey of workers about how their wages have shifted over the last year.
The ECI GLI method tends to show lower growth than the other two methods due to how the ECI index discounts aggregate wage gains from industry/occupation-switching, which should lead to an even larger gap when turnover is high (like today).


These thoughts and explanations are not read by enough of us and certainly none of the finger-pointing politicians confusing everyone. Thanks for a great picture of the inflationary dilemmas!
Great article, I’ve been saying this for a while but charts like these will go in the history books. It’s so interesting to see the mass disruptions to the norm over the last 3 years. It’s really starting to feel like we are 90% through though. I truly wonder what actions will be taken when we encounter another economic crisis, will the Fed learn its lesson on excess or will they do something similar.