The views expressed in this blog are entirely my own and do not necessarily represent the views of the Bureau of Labor Statistics or the United States Government.
Thanks for reading. If you haven’t subscribed, please click the button below:
By subscribing you’ll join over 5,500 people who read Apricitas weekly!
Otherwise, liking or sharing is the best way to support my work. Thank you!
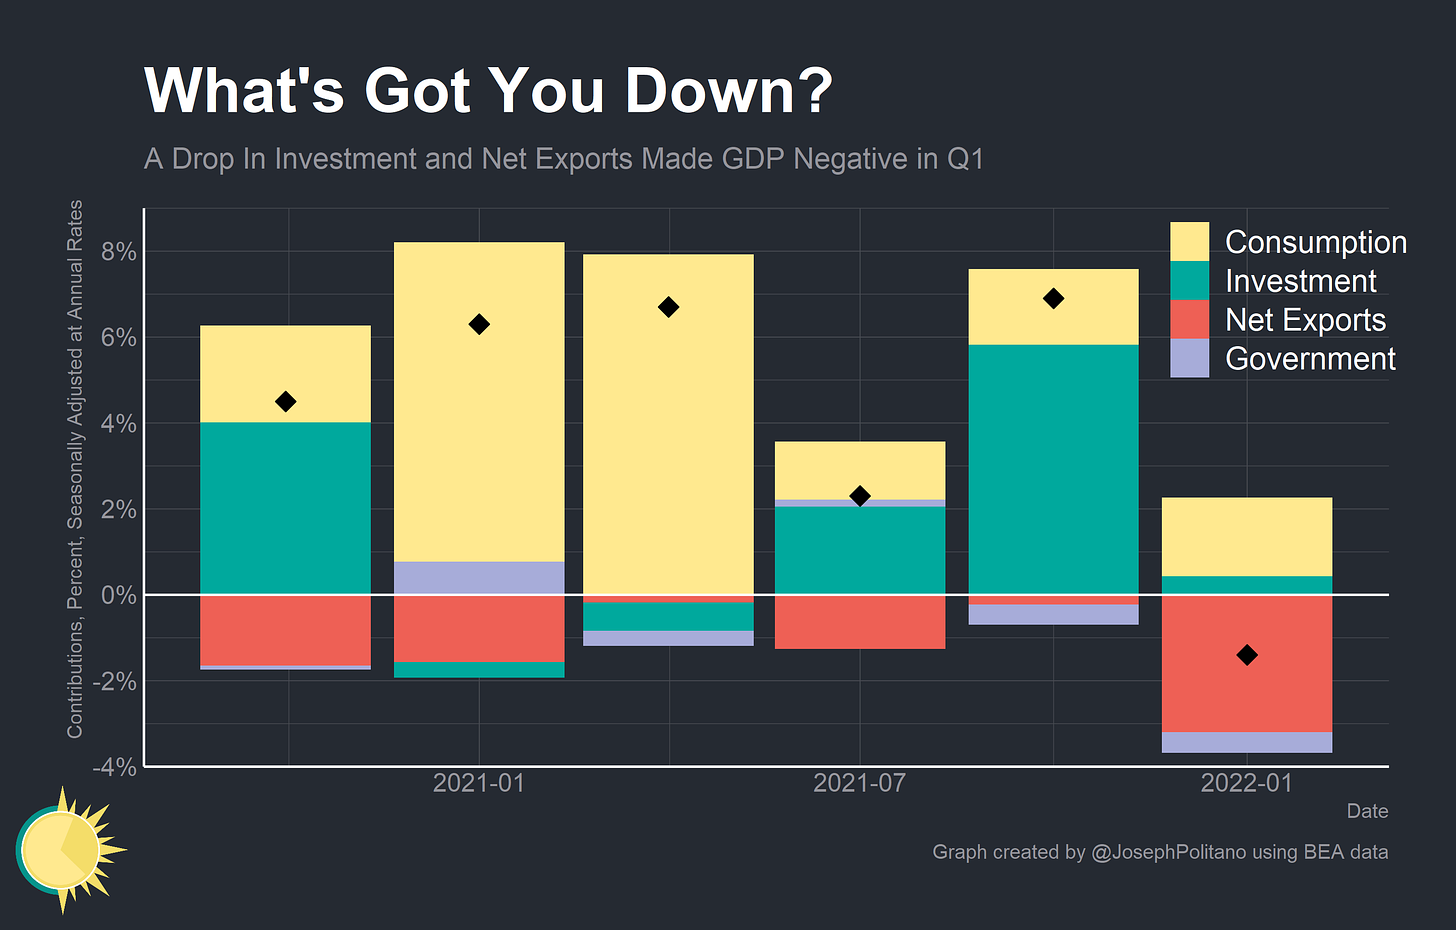
The US’s real GDP declined at a -1.4% seasonally adjusted annual rate in Q1 2022—the first drop in output since the start of the pandemic and a fairly swift reversal of the 6.9% growth in Q4 2022. Drops in GDP are extremely important; two quarters of successive contraction are the unofficial marker of a recession and the US rarely sees output declines outside of major downturns. So is the US economy shrinking?
Technically yes, but recent GDP data has been unusually volatile thanks to the pandemic—and the underlying causes of the drop in Q1 GDP are more a result of statistical and seasonal quirks than a genuine economic slowdown. A lot of it was bad-news-that’s-actually-good: business inventories grew swiftly (but at a slower rate than in Q4 2021) and net exports shrank because backlogged US ports processed more imports. Shifts in consumption, inventory management, and trade patterns caused by the pandemic are interacting with seasonal adjustments to cause weird shifts in quarter-to-quarter GDP.
Domestic hiring, industrial production, and consumption demand were all extremely robust in early 2022. To believe that the US economy is declining at such a rapid rate requires believing that US labor productivity is dropping at the fastest pace since the invention of color TV.
This GDP report should be understood less as a genuine decline and more as an acknowledgement that output was slightly lower at the end of 2021. There are important signs of a marginal slowdown in growth going forward: initial unemployment claims are up off their lows, monetary policy is tightening, and drops in global output are weighing on domestic growth. But a wealth of other data points are extremely inconsistent with the idea that the US economy has already entered the kind of pronounced slowdown that GDP data would indicate. More than anything, this report exposes the flaws in using GDP as a real-time measurement of economic health during the pandemic.
Inputs to Output
GDP is a measure of domestic production: the sum total of economic output in a certain area. Rather than directly calculating output, however, the Bureau of Economic Analysis (and almost all global statistical agencies) effectively take consumption and work backwards. Most economics students are familiar with the equation Y=C+I+G+(X−M) where GDP (Y) is equal to Consumption (C) plus Investment (I) plus Government Expenditures(G) plus Net Exports (X-M)—but most don’t think through what this means for data collection.
As an example, imagine you were trying to measure output of oranges in the US. You could go survey farmers and try to determine how many oranges were grown and picked in a given quarter, but this would be extremely time consuming (and would leave you without a good decomposition of expenditures in the national accounts data). Instead you could look at the number of oranges sold at grocery stores in the US (C) and subtract imports of oranges (M) while adding exports (X). GDP is a measure of domestic production, so imports don’t theoretically reduce GDP; imported oranges are only subtracted from consumption and exported oranges added to consumption in order to arrive at the the total number of domestically-produced oranges. But this example also reveals a flaw in the data collection process: overestimate the size of imports and you underestimate the size of domestic production (and vice versa).
Real GDP growth took a sharp downward turn in Q1—and the culprits were a big reduction in the contribution of investment and an extremely large negative contribution from net exports (the contribution from consumption held about steady, and government expenditures continued to pull output downwards thanks to reduced military expenditure). Trade and investment are volatile components even in the best of times, but during the pandemic their volatility has only increased. Indeed, the decline in net exports looks to be driven by idiosyncratic features of current supply chain and import dynamics rather than a dramatic shift in domestic production. These shifting trade patterns interacted with the seasonal adjustments to “overestimate” output in Q4 2021 and “underestimate” it in Q1 2022.
Terms of Trade
The pandemic resulted in Americans buying more goods, and that surge in goods spending resulted in a growing trade deficit for the US. Again, more imports do not ipso facto mean that domestic GDP is lower—the reason I am bringing this up is that even the record imports numbers of 2021 were pushed lower thanks to supply chain issues. The Census Bureau trade data that feeds into the Bureau of Economic Analysis’ GDP estimates only counts goods as imported in “the month in which the U.S. Customs and Border Protection releases the merchandise to the importer.”
This is an important distinction because ports in the US are currently experiencing unprecedented backlogs. Goods shipped from abroad are not counted as imports until they are released by CBP, so goods sitting on container ships waiting outside the Port of Los Angeles are not (yet) imported. In normal times the effects of this are minimal—shipping times are low and predictable, import volumes are within ports’ capacities, and goods consumption doesn’t move on a dime. During the pandemic the effects of port throughput becomes extremely important to import data.
Imports jumped to a record high in March—but that was actually due to a significant uptick in throughput at major ports (alongside inflation). The Port Authority of New York and New Jersey saw record throughput, and the port of Long Beach got near all-time highs as well. Keep in mind that March imports represent goods that likely departed in Q4 2021—shipping firm Flexport estimates that China-to-US trips currently take an average of 110 days.
Seasonal adjustment also plays a critical role here; in normal times imports are highest in Q4 as retailers prepare for holiday shopping and lowest in Q1 as goods demand wanes. Indeed, non-seasonally adjusted real imports still declined in Q1 2022, but the backlog of container ships and the jump in throughput meant they declined by less than expected. That meant seasonally adjusted real imports jumped to a record high.
Again, imports do not subtract from GDP. If a good is imported it must be either consumed or placed into business inventories, both of which are positive contributions to GDP that make the net effect of imports zero. But if imports are overestimated relative to consumption and business inventories then GDP can be pulled downward and if seasonal import patterns change then seasonal adjustment can make quarter-to-quarter growth stats misleading. A better way to understand the import shift would be “backlogged ports and shifts in trading patterns caused growth to be overstated in Q4 2021 and understated in Q1 2022; the US economy is likely not contracting but it may be slightly smaller than we expected.”
Another note—real exports remain low thanks to voracious US consumption crowding out weaker global demand. Q4 saw a surge in exports across a broad variety of categories due to an ongoing global recovery and increased trade with Mexico and Canada, but Q1 saw a broad slowdown in exports due partially to a major decline in demand from China and Hong Kong thanks to COVID lockdowns.
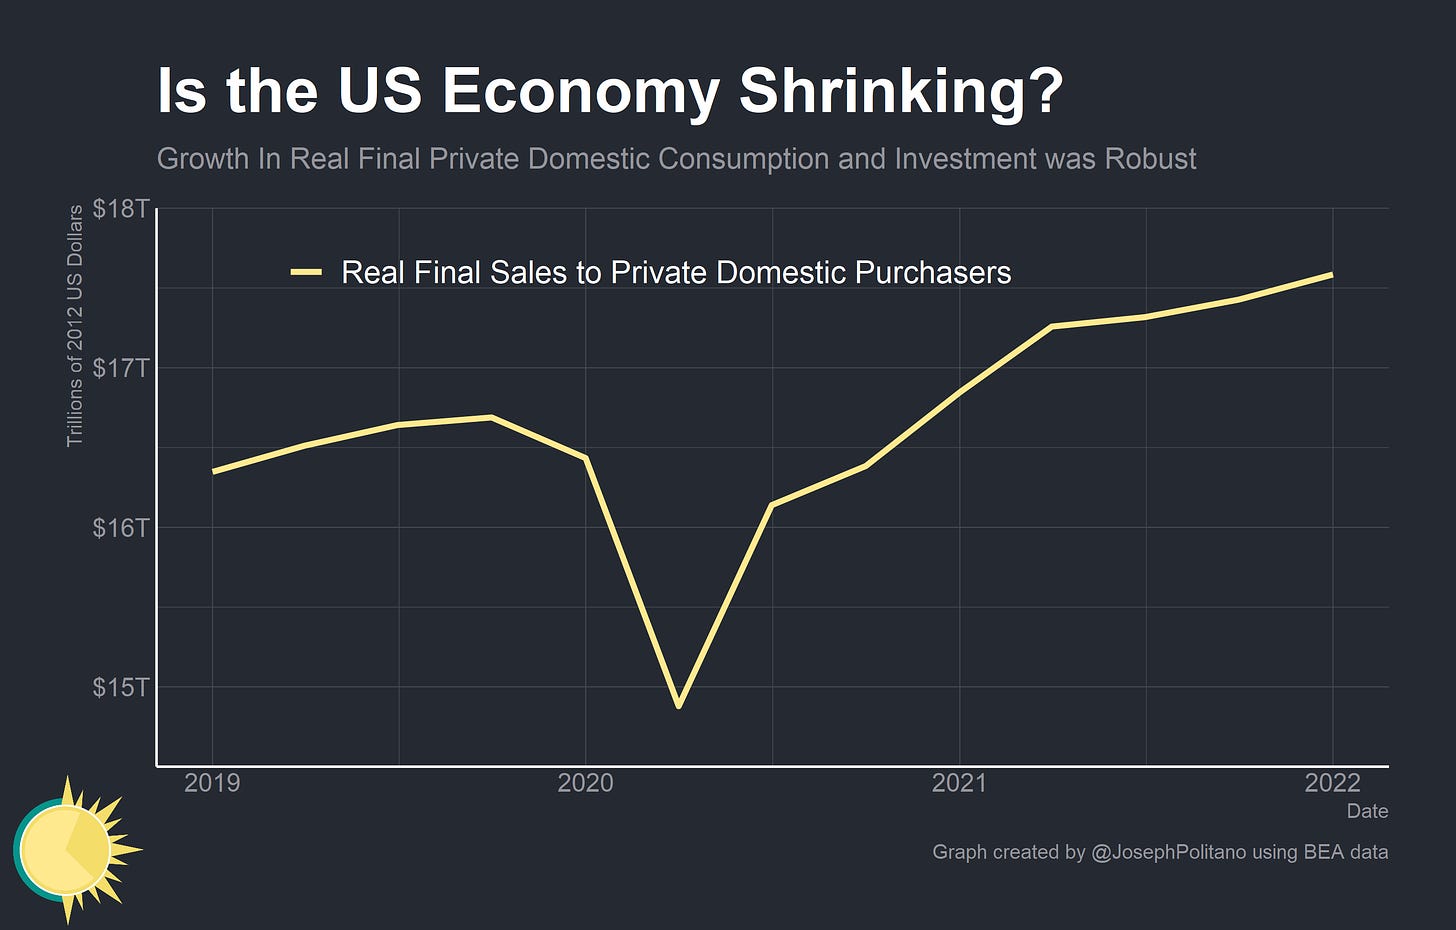
But the US economy is primarily driven by domestic consumption patterns, not foreign ones—and domestic demand remained strong in Q1 despite the decline in output. Real final sales to private domestic purchasers—which measures consumption and investment of non-government entities within the US—grew at a robust pace of 3.7%. At some level this just flips the problem of the GDP data; a quarter with unusually strong import data will likely be one with fairly strong consumption growth. But this measure still helps strip out some of the noise caused the more volatile components of GDP and is an important lagging indicator of a recession.
Taking Inventory
The other idiosyncrasy was in investment, which pushed GDP growth up dramatically in Q4 and barely contributed anything to Q1 growth. The culprit there was business inventories—a historically volatile component that has only seen larger fluctuations during the pandemic.
Inventories are perhaps the least intuitive part of GDP data. To return to our oranges example earlier, if a company bottles up several thousand gallons of orange juice in the summer for sale in the winter then they have “invested” current production to satisfy future consumption. That current production is a positive contribution to GDP, and a situation in which orange companies halt production in order to drain down inventories is a negative contribution to GDP.
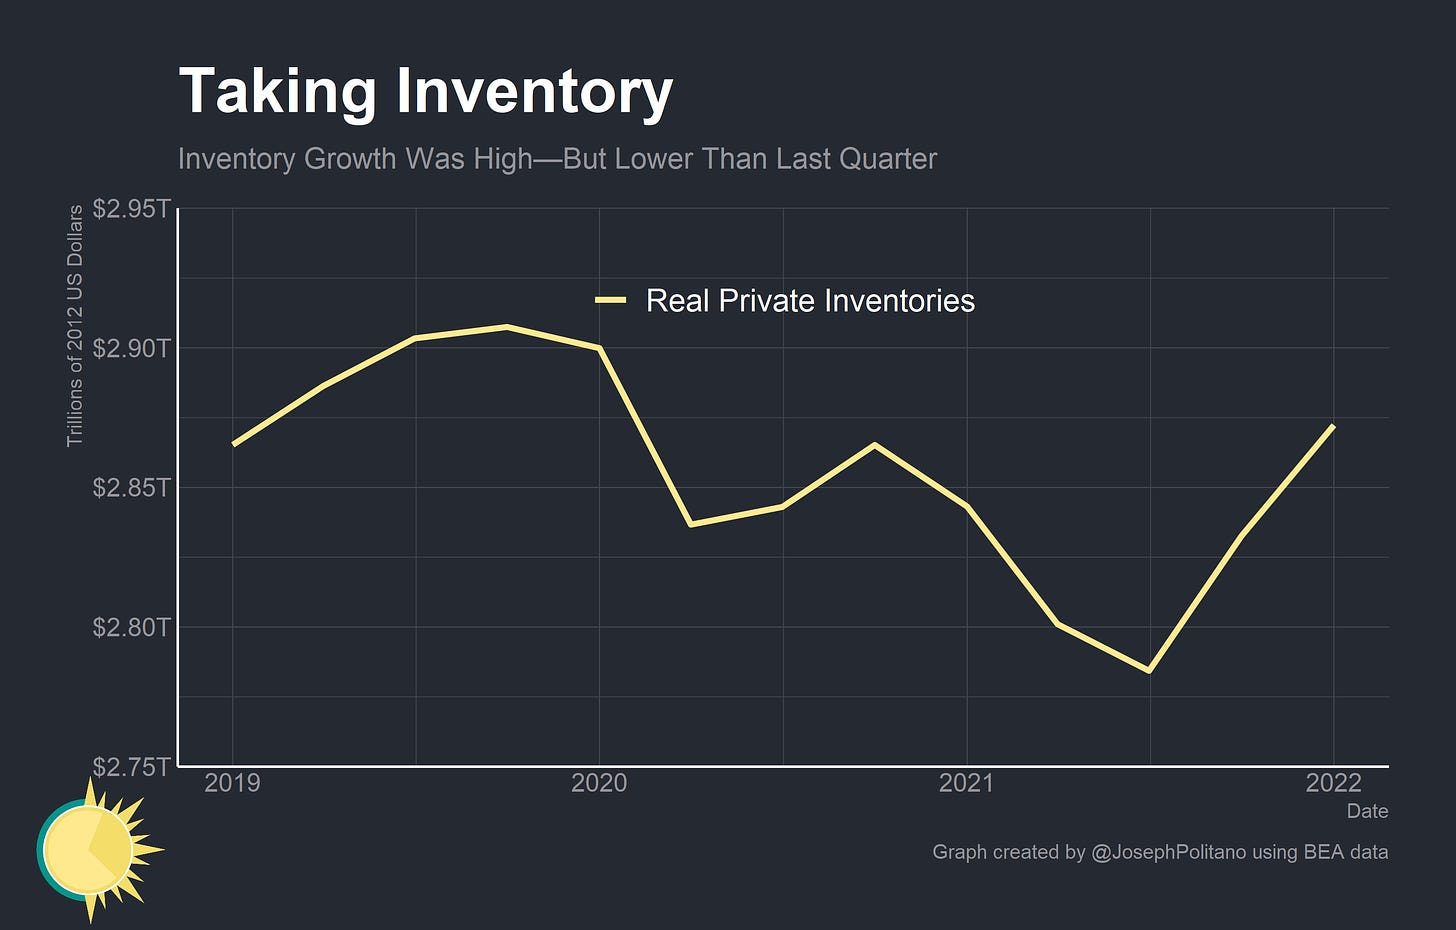
Inventories contributed 5.8% (out of the total 6.9%) to GDP growth in Q4 2021 and negative 0.84% (out of negative 1.4%) in Q1 2022. Keep in mind that inventory growth or inventory size do not directly affect GDP growth calculations. It is instead the change in the change in inventories—the second derivative—that matters in determining quarter-to-quarter growth. Hence why inventories could grow at a rapid rate in Q1 and still have a deeply negative contribution to GDP.
During the pandemic, inventories have fluctuated dramatically as businesses attempt to manage supply-chain snafus. The culprit for the rapid swings in inventories over the last two quarters comes down to the holiday season; corporations intentionally built up inventories faster than usual to protect Christmas shoppers from possible supply-chain issues. In normal times, non seasonally adjusted inventories actually decrease in Q4 as stores get rid of their goods during the holiday season—so the non-seasonally adjusted jump in Q4 2021 caused a massive jump in seasonally adjusted inventories and therefore GDP. In fact, non-seasonally adjusted inventory growth was actually faster in Q1 2022, but seasonal adjustments made inventory’s contribution to GDP very negative.
The contribution of inventories should be moreso understood as seasonal adjustments “pulling forward” growth from Q1 to Q4 than a distinct drop in output. Again, real GDP is smaller than we believed in Q4 2021 but likely is not meaningfully “shrinking” in Q1 2022.
Conclusions
A wealth of other data pointed to a fairly strong US economy in early 2022. Hiring was strong, wage growth was fairly rapid, industrial production was rising quickly, and consumption demand was robust. Indeed, given the strong pace of hiring in Q1 you would need to believe that labor productivity was falling at a 7.5% annualized rate for the drop in GDP to make sense—which would be the fastest drop in productivity since 1950. To be sure, there are plenty of theoretical and practical problems with using quarter-on-quarter labor productivity growth stats for any meaningful analysis of the economy, but the fact that Q1’s labor productivity growth was such an outlier should throw some cold water on the GDP numbers.
This is not to discount the early signals of an economic slowdown that are showing up in higher-frequency economic data. Initial unemployment claims are rising (even though continuing claims are declining and below pre-pandemic levels). Financial conditions are rapidly tightening as the Federal Reserve attempts to control inflation. Energy shocks and shrinking foreign demand are weighing on the US economy. But some of the slowdown is just a downstream consequence of the fact that the US economy has nearly caught up with the pre-pandemic trend. With basically all the “easy” catch-up growth behind us the pace of the recovery was bound to slow down.
The big lesson of the Q1 GDP print should be how bad of a real-time indicator headline GDP has been throughout the pandemic. That’s not to discount the importance of GDP as a number, but it is a recommendation to discount (or at least dig more into) the quarter-on-quarter growth numbers given the variance caused by the pandemic. The headlines championing the 6.9% growth in late 2021 were just as misleading about the state of the economy as the headlines bellyaching over the -1.4% growth in early 2022. If you’re looking to truly understand the changes in the pandemic economy as they happen it’s best to look elsewhere first.


I fear the tightening liquidity, especially through balance sheet shrinkage is going to be the serious impediment to maintain growth going forward. One need only look at the survey data to recognize that activity is slowing and ultimately, the trailing data will follow.
Why would pre-pandemic trend be the goal of the US economy going forward? Isn’t it possible to assume that pre 2008 trend is achievable? There is -I think- a risk: to underestimate the true potential of the most innovator, creative and productive major economy. Regards & Thanks for Apricitas