Mapping Europe's Natural Gas Crisis
Cut Off From Russian Exports, the Continent Struggles to Replace Lost Supplies
Thanks for reading! If you haven’t subscribed, please click the button below:
By subscribing you’ll join over 7,400 people who read Apricitas weekly!
Otherwise, liking or sharing is the best way to support my work. Thank you!
European economies are dependent on foreign natural gas. The continent has a ravenous appetite to satisfy demand for home heating, electricity production, and industrial production. Half of German homes are heated using natural gas, half of Italian electricity comes from natural gas—and domestic EU production has halved over the last decade. The EU is now left importing 80% of its natural gas needs from abroad.
Russia—long the EU’s largest provider of natural gas—exploited this weakness to gain economic and geostrategic advantage in preparation for its invasion of Ukraine. Unlike crude oil, natural gas is not very fungible—transporting the stuff absent pipelines requires expensive liquefication and regasification processes with limited global capacity. Without Russian gas, there would be limited places for Europe to turn.
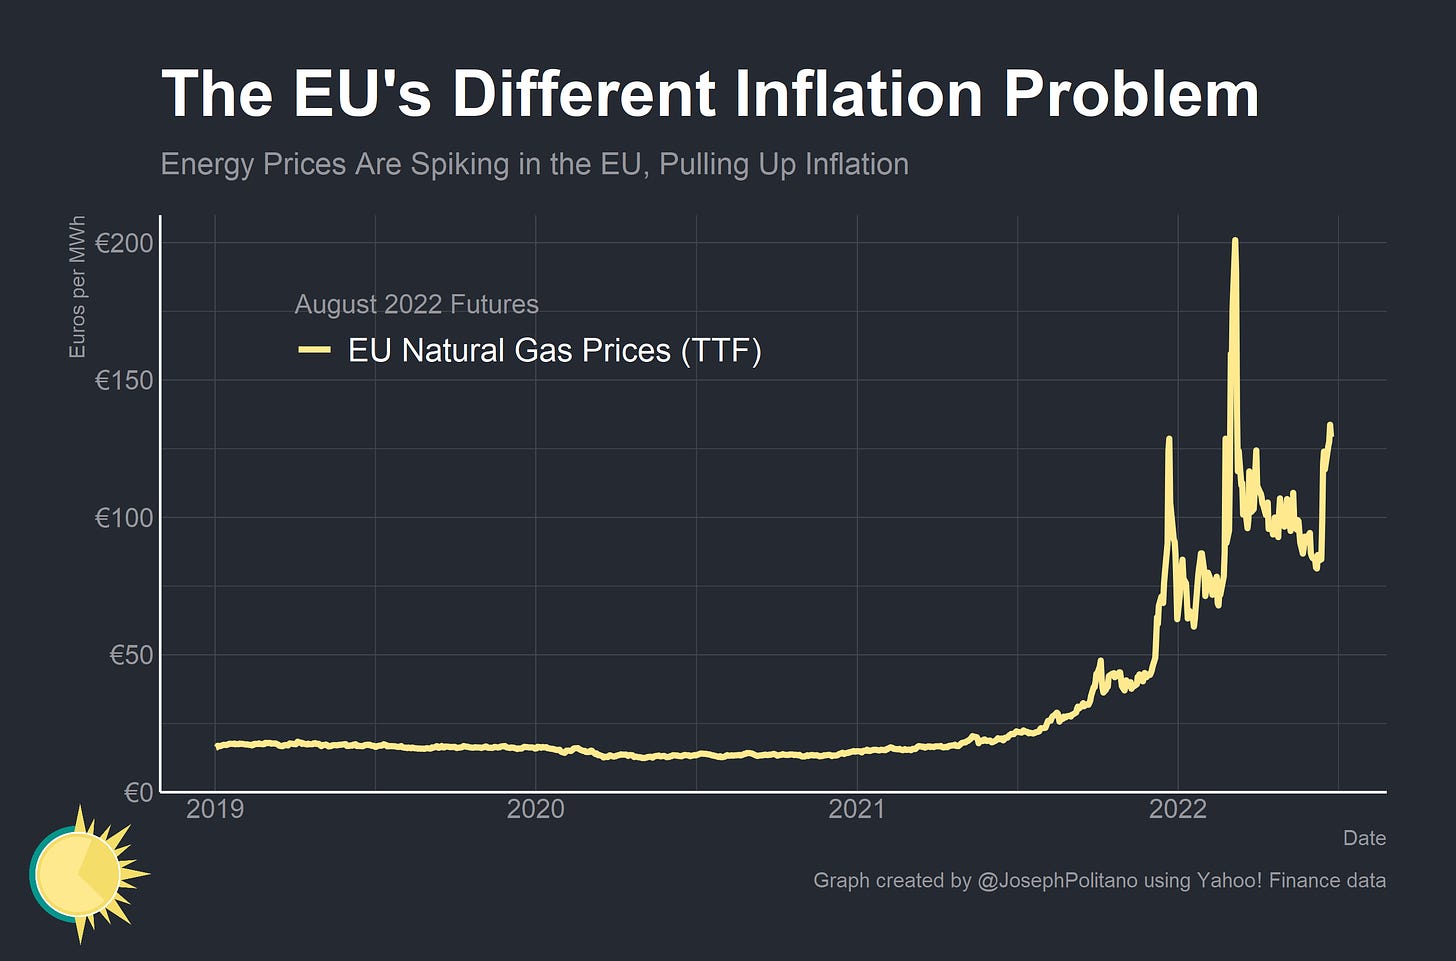
Knowing this, Russia kept gas exports low throughout 2021—even as prices rose significantly in Europe. China, then out of lockdown and struggling to meet domestic energy demands, was importing record amounts of Liquefied Natural Gas (LNG) from global markets—crowding out European demand. By the time that Russia formally launched its invasion of Ukraine earlier this year the rise in gas prices had become a veritable crisis.
The good news is that so far European governments have avoided the catastrophe scenario. Luckily for them, Chinese energy demand evaporated as the country went into lockdown just as Russia formally launched its invasion. High prices drove a mad dash to get more LNG capacity online, with many countries turning to Floating Storage and Regasification Units (FSRUs)—specialized marine vessels boats that can store, transport, and regasify LNG.
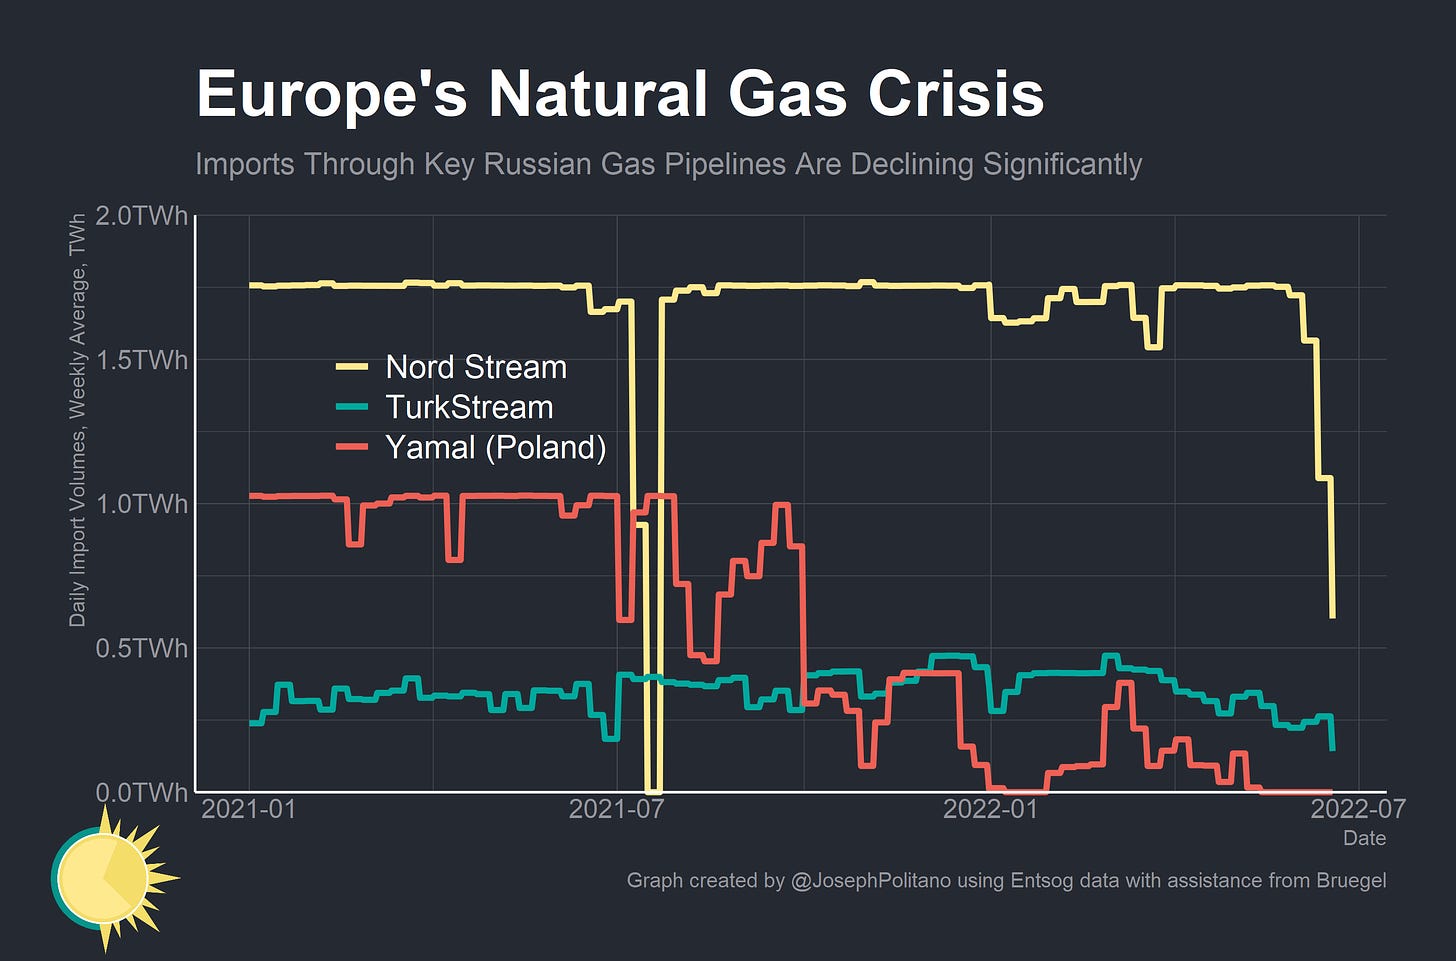
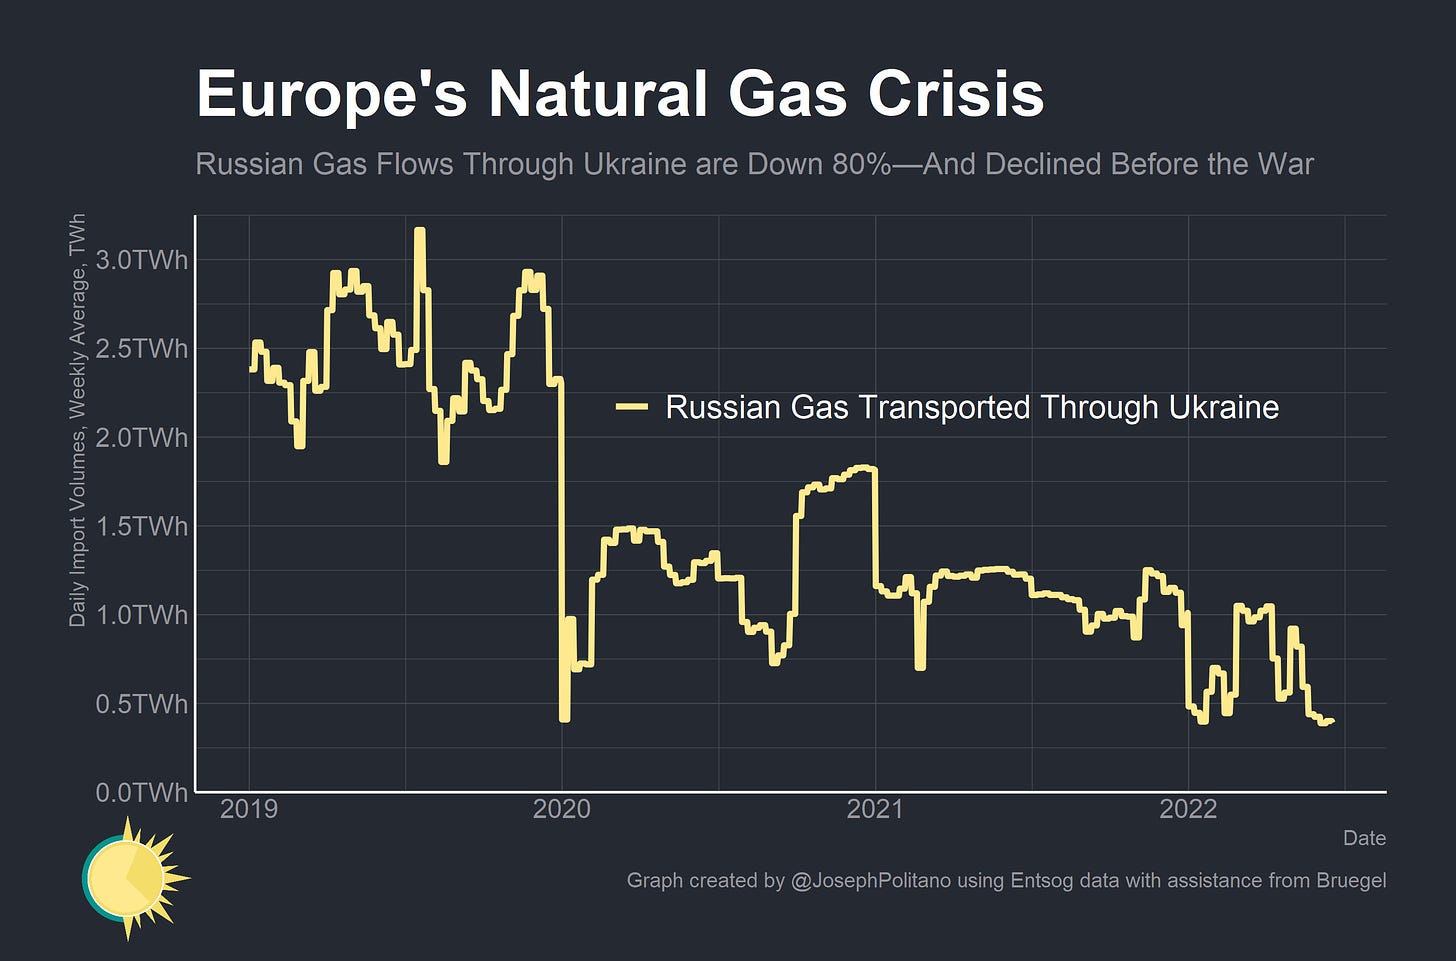
The bad news is that Russia is turning up the pressure. Exports to Europe were already low before the war, sank afterwards, and are dropping further now. Blaming sanctions, Russian majority state-owned natural gas firm Gazprom is cutting exports through the Nord Stream pipeline to Germany by 60%. Exports through the Turkstream pipeline are down 50% from their highs while exports through the Yamal pipeline to Poland are now 0. Export volumes through pipelines in Ukraine are down 80% from pre-pandemic levels and more than 50% from pre-invasion levels. There is a real risk that storage buildups will not be sufficient to get Europe through the winter without significant consumption cutbacks.
Using data pulled directly from the European Network of Transmission System Operators for Gas (ENTSOG) we can gather nearly real-time information on the composition of European natural gas flows. There are significant problems with the data (see footnote1), but it remains the best way to monitor the drop in Russian natural gas exports and the alternative sources that Europe is forced to turn to in order to compensate.
Energy Warfare
As mentioned earlier, Gazprom has decided to cut exports through the Nord Stream pipeline to Germany by 60%. The company blames German firm Siemens—who had sent a turbine to Canada for repairs and now cannot get the turbine back due to sanctions—for the cut. Talks are being held to get the turbine back to Europe, but the fundamental issue is political more than mechanical. European countries are attempting to build up significant stores of natural gas for the incoming winter—and were close to getting back to normal inventory levels before Russian exports were cut off. The move pushed Germany to move to stage 2 of its emergency gas plan—just one stage short of state intervention—while the country looks to restart coal power plants in order to alleviate electricity pressures.
The Nord Stream cutoff is just one part of what has been a broad-based decline in Russian gas exports. Flows through the Yamal pipeline have been decreasing since last year—culminating in a total ban of exports through the pipeline in retaliation for sanctions. Flows through the TurkStream pipeline to Bulgaria are also down 50% from their all-time highs and saw a further reduction recently.
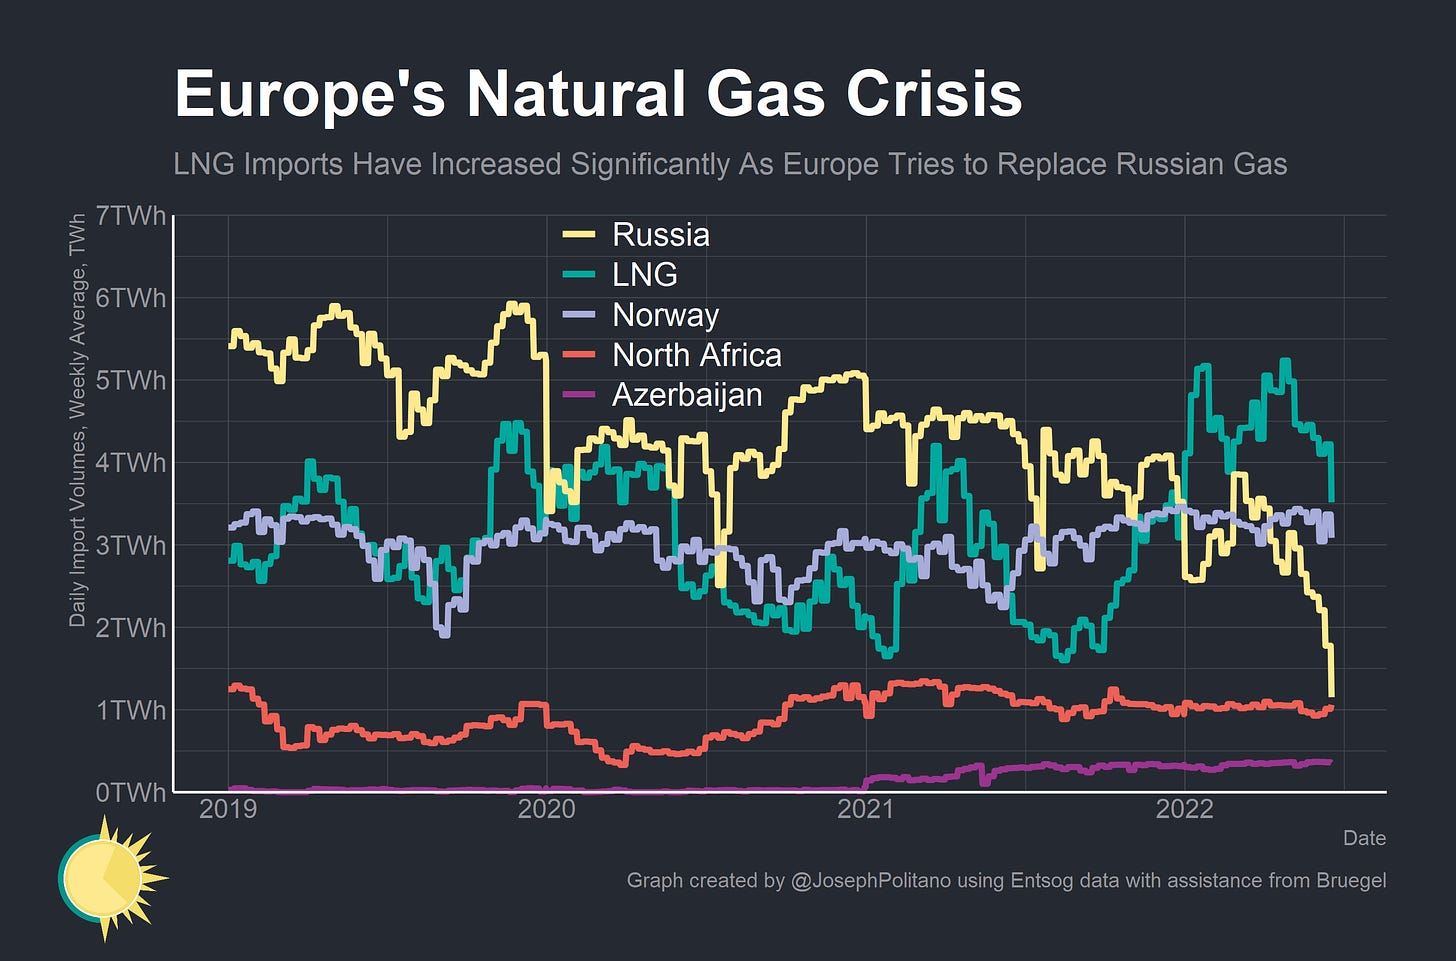
The biggest drop, however, comes from the network of pipelines that transport Russian gas through Ukraine to Poland, Slovakia, Hungary, Romania, and beyond. Flows here declined significantly at the start of the pandemic and remained low in the leadup to the Russian invasion. Combat operations have made normal operation of the gas transit network difficult, and Russia has proven unwilling to utilize spare capacity in the Ukrainian network to balance out declines in other pipelines. The end result is that Russian exports to Europe are down approximately 80% from pre-pandemic levels—forcing Europe to turn elsewhere.
The Arsenal of Democracy
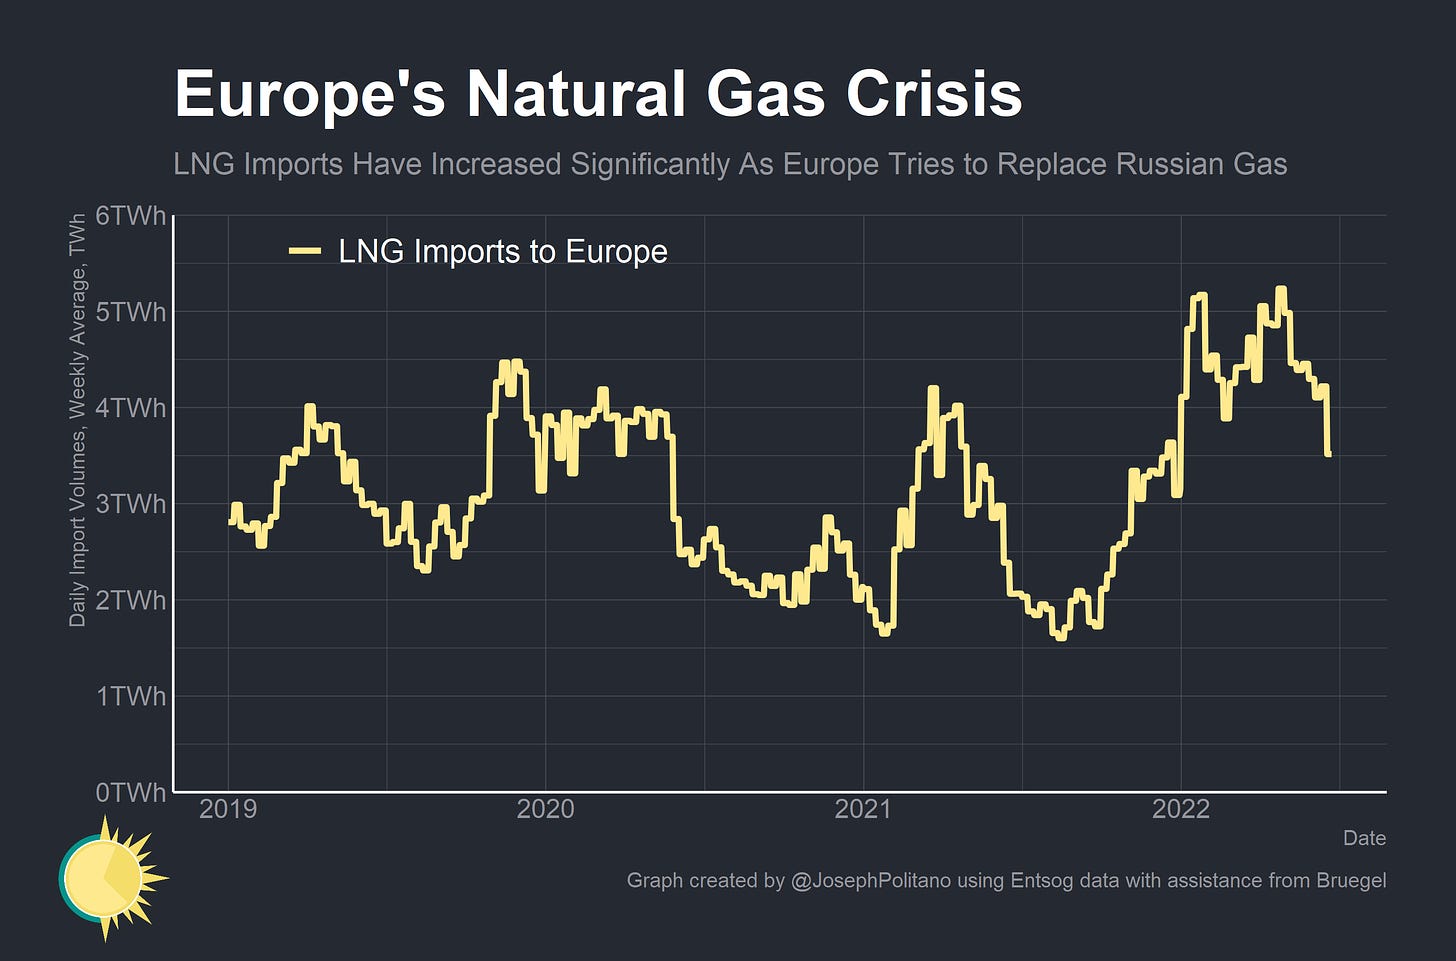
In their searching, European countries have few options. Import capacity through pipelines from Norway and North Africa (mostly Algeria with a small contribution from Libya) are fairly limited—and both nations were utilizing near-max capacity by late 2021. The recent introduction of Azerbaijani gas through the Trans Adriatic Pipeline has provided some relief—but imports there pale in comparison to the lost Russian supply. The only option available was to rapidly increase the LNG import capacity on the continent and persistently run LNG import terminals at max capacity. That’s exactly what’s happened—LNG imports were 25% above their 2021 highs and are 75% above their levels from this time last year.
Looking at the major sources of European imports makes the pattern clearer: as Russian exports have declined over the last year LNG imports have risen in tandem to take their place. The net result is still not enough natural gas to satisfy demand at anything approaching pre-pandemic prices, but LNG remains the only thing preventing an extreme shortage.
Critically, it will be extremely difficult to for LNG imports to make up for Russian exports if the recent dip is sustained. Europe is already absorbing a massive chunk of global LNG capacity—both on the import and export side—and there simply may not be enough remaining spare capacity to prevent a cutback in consumption. Western European countries like Spain, France, and the UK have a disproportionate share of the continent’s LNG capacity, with countries like Germany and Sweden lacking a single terminal. Major new investments in capacity are planned across the continent (including four FSRUs in Germany), but it will take precious time for these to come online.
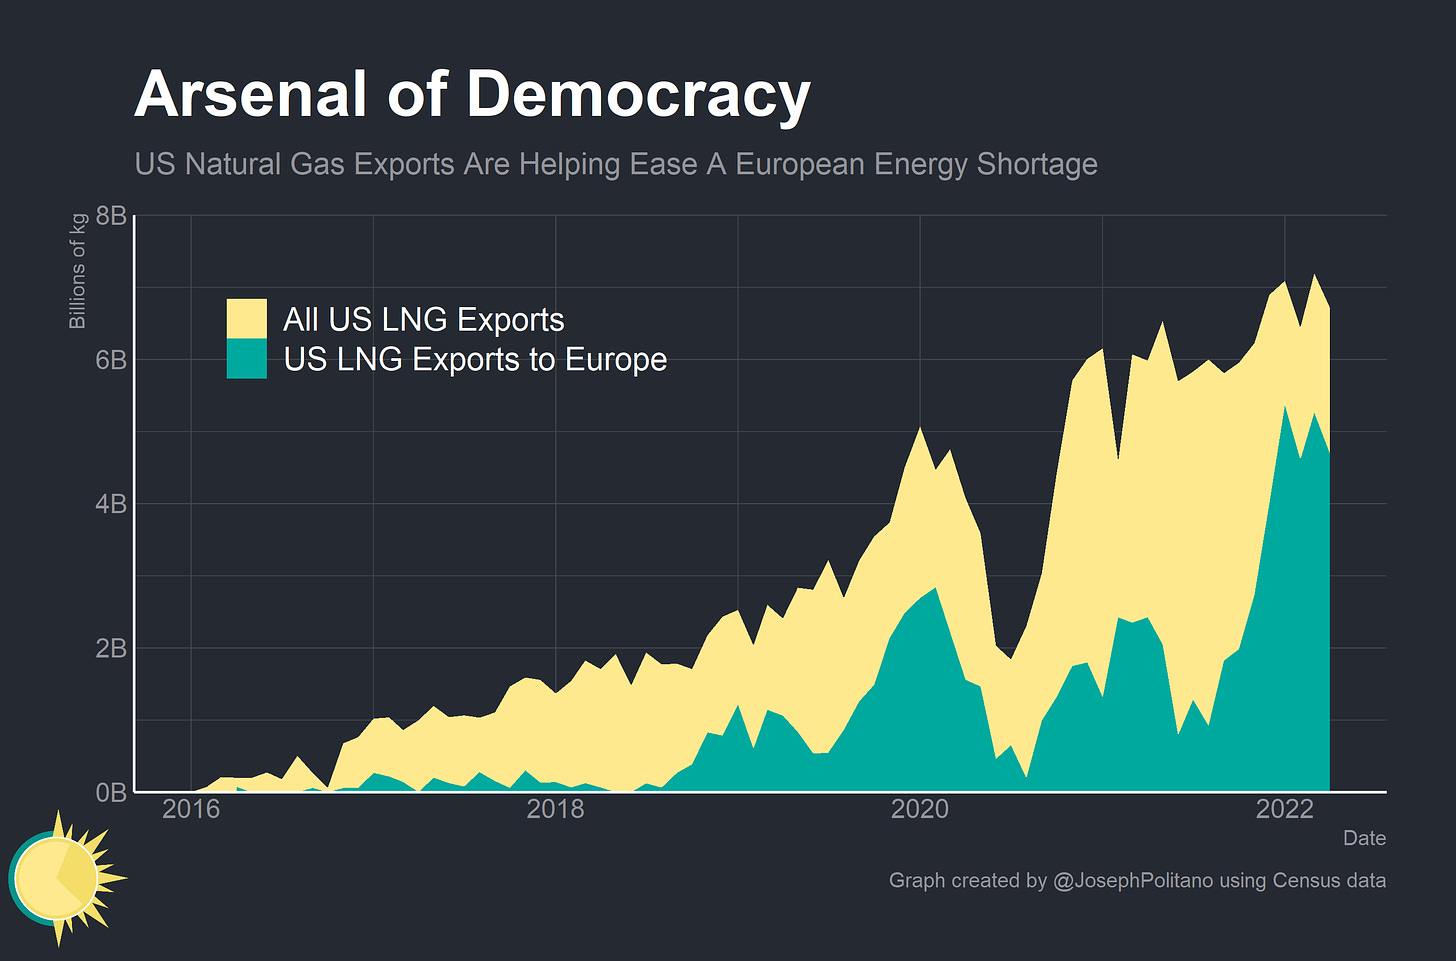
Historically, those LNG exports tended to come from nearby energy exporters like Russia, Qatar, Nigeria, and Algeria. But imports increasingly come from the US as companies look to take cheap American natural gas to expensive markets abroad. The US accounted for 26% of exports to the EU and UK in 2021 and has likely supplied roughly half of continental LNG imports since January. Marginally more liquefication capacity is expected to come online in the US next year which, alongside increased capacity in Australia and other nations, should further assist Europe in covering the Russian natural gas shortfall.
Conclusions
Just after the Russian invasion of Ukraine, the International Energy Agency published an ambitious plan to reduce EU natural gas imports from Russia by a third within the year. Since then, weekly imports from Russia have dipped nearly 75%—underscoring both the scale of the energy shock and the remarkable amount of effort deployed in alleviating it.
Still, consumption cutbacks are real and extremely painful. German firm ONTRAS’s industrial customers have cut their consumption by 40% compared to this time last year, and the UK’s National Grid reports a similar decline in consumption by British industrial offtakes. Households have been a bit more insulated, but the cutbacks are still there—consumption through private distribution companies in the Netherlands is down 20%. Keep in mind that many European households have so far been protected from higher prices by one-to-two year fixed contracts, but contract turnover would therefore result in massive price hikes for many consumers.
Inventory levels remain remarkably strong relative to the supply situation, but further deterioration in import levels could force national governments to make extremely tough decisions. The Chinese lockdowns essentially bought European leaders much-needed time to get through last winter, but they now need to keep a constant eye on securing supplies for the upcoming winter. In the meanwhile, the ability for LNG imports to replace lost Russian imports will continue to determine the continent’s energy outlook.
Public use data generally faces significant tradeoffs between precision, timeliness, and complexity. ENTSOG’s natural gas flows data is decidedly in the complex, timely, and imprecise camp. In assembling this data I was forced to make several ultimately arbitrary decisions in order to work out the final data aggregates. For example: ENTSOG lists a Spanish LNG aggregate that does not equal the combination of all individual Spanish LNG terminals (I went with the individual terminals data). The UK’s National Grid listed different multiple slightly different import levels for the same days at certain terminals (I went with the first listed datapoint). Day-to-day fluctuations are large for certain datapoints, so I often used weekly averages to make the charts readable. The data for certain terminals is released with a larger lag than others, so I decided to exclude the most recent week of data from many charts. Given all this, please treat this data as a best approximation of underlying trends instead of an exact measurement. I will be continually working to improve the data analysis for use in future pieces. Ultimately, in my own tradeoff between precision and timeliness I decided it would be better to publish now than to wait.
I also want to take this opportunity to thank the think tank Bruegel for assembling a similar analysis and sharing their underlying data with me. I want to especially thank Ben McWilliams for answering my questions and helping me confirm the results of my analysis.



Great analysis, thank you!
Excellent analysis! Thanks!