Progress in the Fight Against Inflation
On Two Fronts, Price Growth is Slowing Down. What Does it Mean for the Fed?
Thanks for reading! If you haven’t subscribed, please click the button below:
By subscribing you’ll join over 19,000 people who read Apricitas weekly!
Otherwise, liking or sharing is the best way to support my work. Thank you!
Inflation came in below expectations this morning, with headline CPI inflation dipping to 7.1% year-on-year (0.1% month-on-month) and core CPI inflation dipping to 6% year-on-year (0.2% month-on-month). Combined with better-than-expected inflation data in October and the ongoing trends since the middle of the summer, slow progress is steadily being made in the Federal Reserve’s fight against inflation.
This progress comes on two fronts: the immaculate disinflation coming from price declines in energy and core goods as supply chains normalize, and the intentional disinflation coming from the Federal Reserve’s tighter monetary policy working through the economy. On the first front, price declines in gasoline and motor vehicles have played a critical role over the last few months, and on the second front declines in aggregate income and demand are slowly passing through to the broader economy.
The progress comes at a critical time as the Federal Open Market Committee decides how much to raise interest rates this week. Their job in fighting inflation is clearly not finished, but signs are starting to emerge that they’re making progress in bringing inflation back to target and may be able to slow the pace of rate hikes going forward.
Immaculate Disinflation
Prices for different items and different sectors exist on a spectrum of how directly influenced they are by the stance of monetary policy. Food and energy are the classic highly-volatile sectors that exhibit little relationship to changes in interest rates—that’s why the Federal Reserve usually targets “core inflation” metrics that exclude food and energy. However, goods like motor vehicles or clothing exhibit also exhibit relatively little direct relationship to monetary policy—especially as the pandemic radically reshaped the global economy and caused significant issues in supply chains.
In 2020 and 2021, the bulk of inflation came from these goods, food, and energy that shot up in price during the pandemic. Nowadays the majority of inflation comes from core services, and it is actually the sectors less influenced by monetary policy that are helping to pull inflation down.
Take energy: increases in oil and gas prices since the end of 2020 have pushed up overall inflation, especially since the Russian invasion of Ukraine caused an oil and refining supply crunch. Since this summer, however, supply conditions have steadily improved and demand—especially from China—has waned, bringing gas prices back down to where they were this time last year. Just as rising oil prices passed through a bit to goods in other sectors (like taxi rides or plastic products), falling oil prices should also provide a minor headwind to inflation outside of the direct effects of falling gasoline prices.
Used car and truck prices are also finally declining, dropping 2.8% last month alone, and new car prices appear to be stabilizing a bit. American auto production has finally exceeded the 2019 average after falling significantly amidst the semiconductor shortage last year, and that supply improvement is helping to alleviate the 4.5 million cumulative production deficit since the start of the pandemic.
In fact, this is the first time since the start of the pandemic that used vehicle prices have declined on a year-on-year basis. Growth in other durable goods prices—like new vehicles, furniture, and appliances—is also dropping as supply chains improve and consumer demand rebalances. Overall goods prices excluding food and energy have now declined nearly 1% from their peak in August—a big reversal from the more-than-2% increase in goods prices we saw over the same time period last year.
Intentional Disinflation
On the intentional front, tighter monetary policy is slowly making its way through to spending aggregates and thereby the cyclical components of core services inflation that are most influenced by shifts in interest rates. Housing prices continue to increase, but since CPI data lags new tenant rent indices by about one year we know that a turning point should be coming relatively soon.
Outside of housing we are also seeing a deceleration in services inflation, with the index of services less shelter prices essentially stagnant since September. That’s partially thanks to drops in healthcare prices that have only manifested in recent months thanks to BLS methodological quirks, but even outside of healthcare core services inflation looks to be improving.
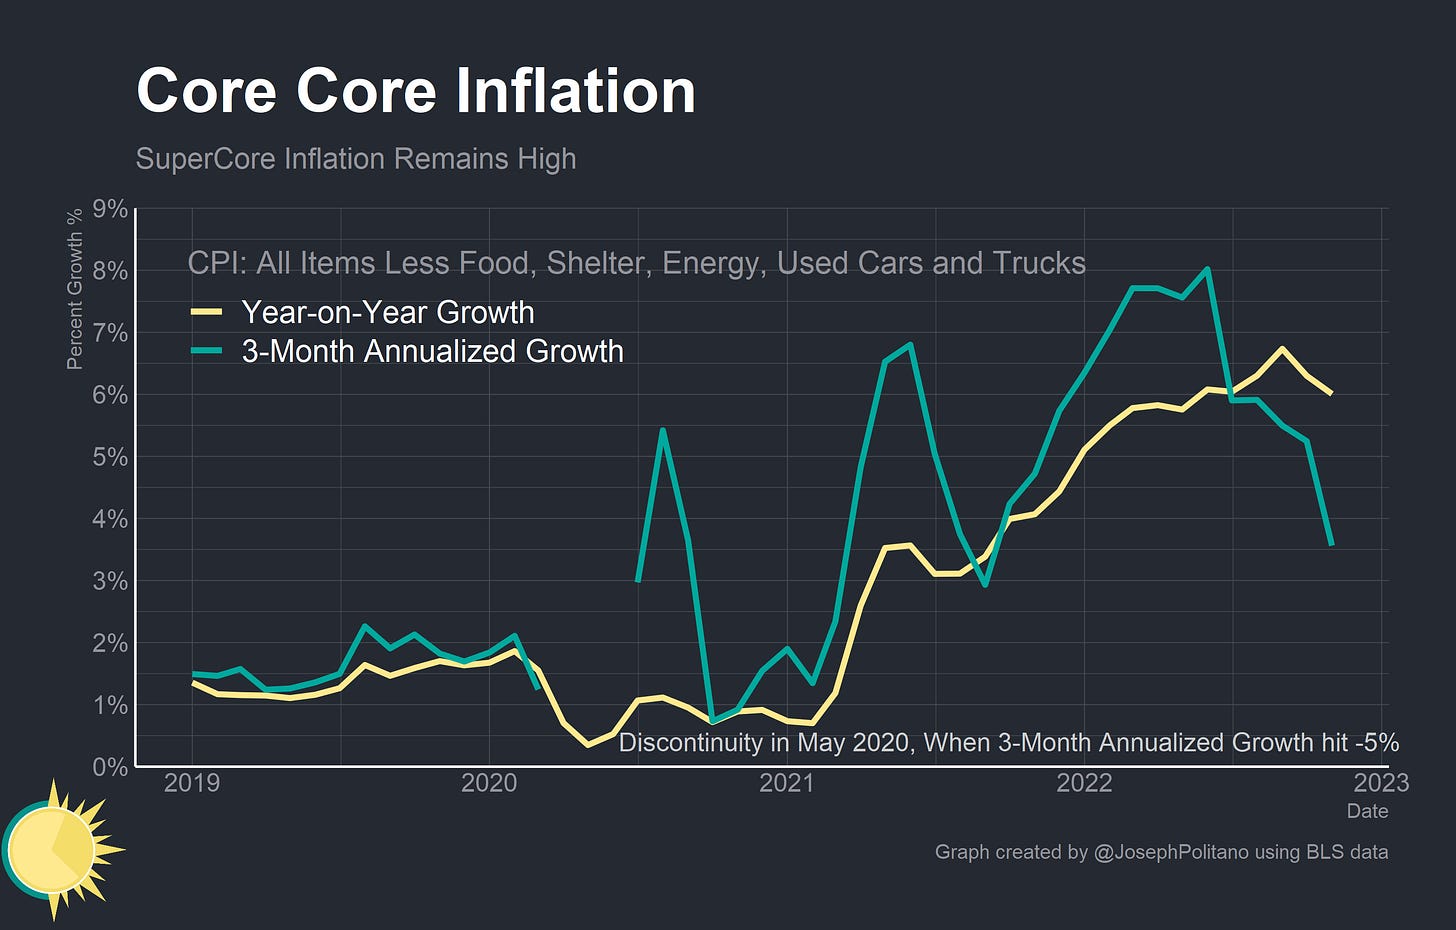
In fact, if you take “super-core” inflation—by excluding lagging components like housing and volatile components like food, energy, and used vehicles—the trend becomes relatively clear. Year-on-year growth has decelerated to 6% and the 3-month growth has decelerated towards 3.5%.
Conclusions
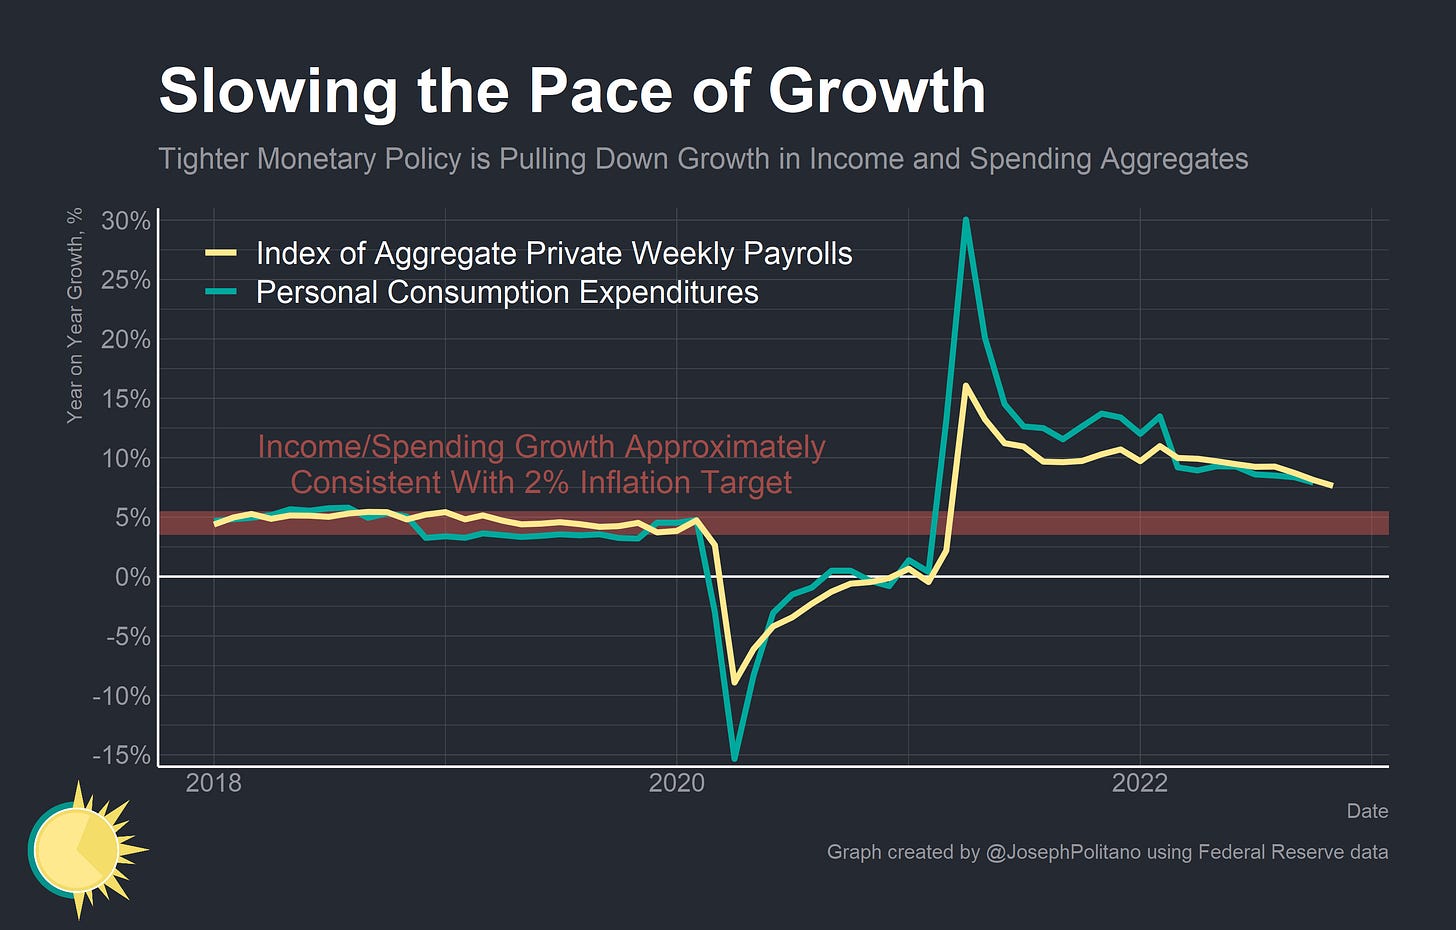
However, the pace of aggregate income and spending growth still remains too high to be consistent with on-target 2% inflation. Aggregate weekly payrolls grew by 7.5% over the last year, about in line with aggregate personal consumption expenditures and significantly higher than the 3.5-5.5% that would be very roughly consistent with the Federal Reserve’s 2% inflation target. We’ve simply not seen a large enough slowdown in aggregate spending and income growth over the last few months to declare mission accomplished, but we may have seen enough to justify a slowdown in rate hikes.


Don't understand why you treat this a sectoral phenomenon (these prices are up a lot, those not so much). Inflation is economy-wide. It's about NGDP. In any inflationary phase, some sectors will be up more than others. That doesn't matter. What matters is the big picture. If demand is under control, inflation will moderate, still varying across sectors. At least mention the big picture.....