Thanks for reading! If you haven’t subscribed, please click the button below:
By subscribing you’ll join over 19,000 people who read Apricitas weekly!
Otherwise, liking or sharing is the best way to support my work. Thank you!
This economy has been incredibly complicated this year, to put it lightly. Between generationally high inflation, a global energy crisis, tightening monetary policy, a slowdown in the economic recovery, and the ongoing effects of the COVID-19 pandemic, uncertainty is clearly in abundance.
I’ve covered a lot of ground in writing about the global economy this year, and so as the year wraps up I wanted to take a moment to refocus on the core themes underlying our current economic situation and discuss the most important variables going forward. This piece will look back on the economy in 2022, and part two coming out next week will cover the outlook going into 2023. Without further ado, here are 11 charts on the themes that shaped a wild year in the macroeconomy.
Don’t Call it Stagflation
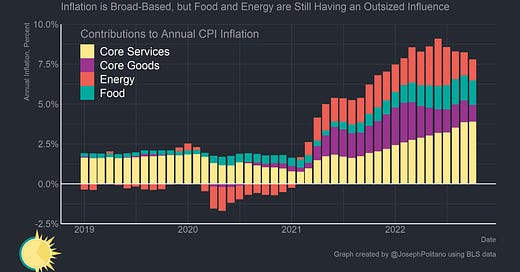
There are three things that have defined 2022: Inflation, inflation, and inflation—global price increases have dominated the conversation and the direction of economic policy, with good reason. Price growth sits at a 40-year high in the United States and remains elevated across the world as the global economy continues to deal with a mismatch between supply and demand. The surge in inflation that started in 2021 was only accelerated when the Russian invasion of Ukraine damaged global energy and food commodity markets, and demand for goods, which was supposed to abate as widespread vaccination allowed the economy to rebalance, has mostly remained at elevated levels. But inflation has become much more of a broad-based, cyclical story this year—and growth in core services now makes up the bulk of year-on-year growth within the Consumer Price Index.
That means housing prices, which move with a lag to market conditions, and labor-intensive services now make up the bulk of price growth in the US, and it is these demand-driven components that now make up a large chunk of excess inflation in the US. At some level that should not be surprising considering that nominal gross domestic product and nominal gross labor income have both exceeded their pre-pandemic trend and continue to grow at rates significantly higher than what would be consistent with 2% inflation.
There is, to put it bluntly, a case of too much spending in the US which has mixed with the already-supply-constrained economy and a damaged global supply chain to produce widespread, broad-based price growth.
At the same time, the US economy saw a significant slowdown in economic growth this year. At first, the slowdown seemed less obvious—a possible fluke in GDP data that seemed inconsistent with rapidly rising employment and growing industrial output—but as the year has drawn on it has become clear that real economic output has taken a hit from the supply issues plaguing the global economy and the efforts from the Federal Reserve to tame excess demand with tighter monetary policy. The persistence of inflation coupled with the slowdown in growth has mostly dashed the idea that the policy response to the pandemic could leave the US economy in a better place than it entered. The US may still be in the best position of any major economy, but that is damning by faint praise given the status of Chinese and European economies—although today’s economy is radically different from the 1970’s, the combination of high inflation and weak growth has at least been replicated.
The Energy Crisis: There and (Mostly) Back Again
A big driver of both the economic slowdown and the rise in inflation has been the global energy crisis that intensified in 2022. To start the year, oil and gas prices were already high thanks to weakened investment appetite from US oil producers after the pandemic wiped away most of their profits. The Russian invasion of Ukraine only sent oil prices soaring higher, and the loss of significant Russian refining capacity amidst sanctions and other trade restrictions sent gas prices up even more than oil prices.
By and large, though, oil markets are now back where they were at the start of the year (with the extremely notable exceptions of diesel and jet fuel, whose prices remain high as refinery capacity shortages still bite). A massive slowdown in Chinese energy demand amidst ongoing lockdowns, the stabilization of Russian crude output, growth in American oil output, and a historic release from the Strategic Petroleum Reserve helped to stem the price increases in the oil market this year.
The situation in natural gas and electricity markets isn’t quite as rosy, however. As Russia’s military situation in Ukraine deteriorated they began cutting natural gas supplies to Europe dramatically. The EU has managed to replace Russian production with increased imports from the US, Norway, North Africa, and elsewhere, and the bloc is pulling unprecedented amounts of gas from global LNG markets, but this has still come at an extremely significant cost. European governments appear to have enough gas stored to last throughout this winter and European industry is adapting well to energy scarcity, but the shortage still represents a years-long headwind for European economies.
Supply Situation Still Stuck
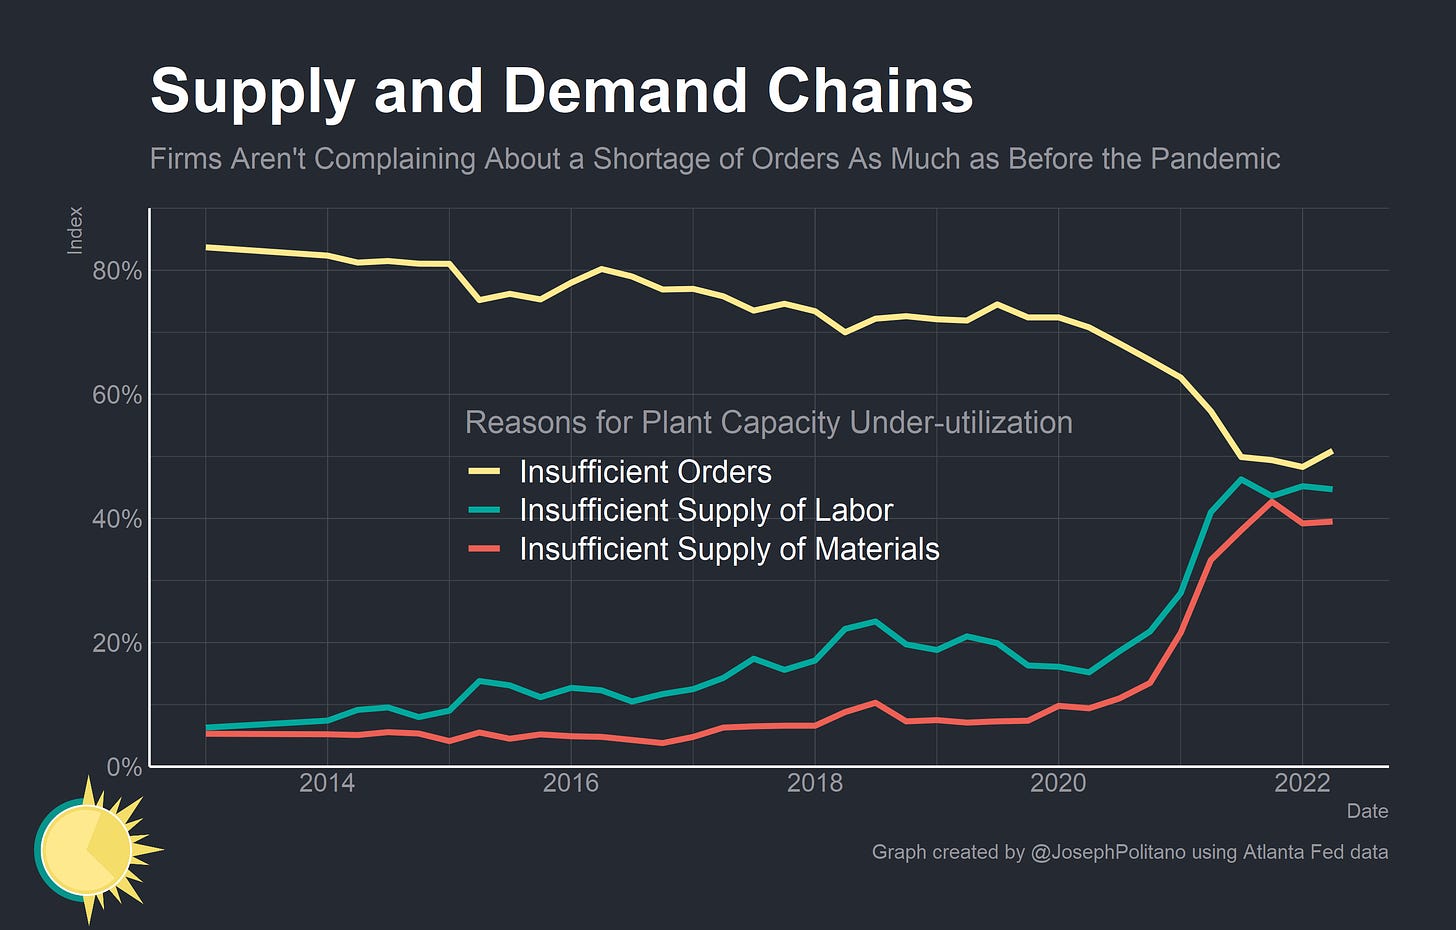
The supply-chain situation, though it has arguably improved so far this year, still remains historically bad. The share of American factories reporting that material, labor, and transportation constraints are preventing them from operating at full capacity is still sitting at multi-decade highs. Transoceanic freight travel times are declining-yet-elevated even as prices return to normal, and overall supplier delivery times have only started improving in recent months.
One critical supply chain emblematic of the improvements made this year and the continued problems across manufacturing industries is the car market. The semiconductor shortage of 2021 caused a massive dent in American production, leading to a cumulative production shortfall of 4.5 million vehicles and rapid price increases for new and used vehicles. Since the start of this year, production has finally recovered to pre-pandemic levels—but no measurable dent has been made in the shortfall.
Tightening Up
Damaged supply chains, rising energy prices, and high cyclical inflation have led the Federal Reserve to engage in a nearly-unprecedented pace of rate hikes this year, with target interest rates rising by 3.75% in 2022. The explicit goal of the Fed was to tighten credit throughout much of this year in an effort to bring demand back in line with supply, and they have thereby caused significant deterioration in financial conditions and increases in recession risks. Credit spreads on high-yield corporate debt remain elevated, indicating both worse borrowing conditions for major companies and deterioration in the broad macroeconomic outlook.
The rapid rise in interest rates has also passed through to even-higher mortgage rates, with 30-year fixed rate averages rising from 3% at the beginning of the year to a high of 7% in October. That’s caused a 30% drop in single-family home starts, a big drop-off in residential fixed investment, a stagnation in residential building employment, and (so far) a slight decline in the Case-Shiller US home price index. Housing is arguably the sector by which interest rate hikes have the clearest effects on both demand and supply, so it is obviously a key component of Fed-driven shifts in the business cycle.
Excess Savings turn to Excess Spending
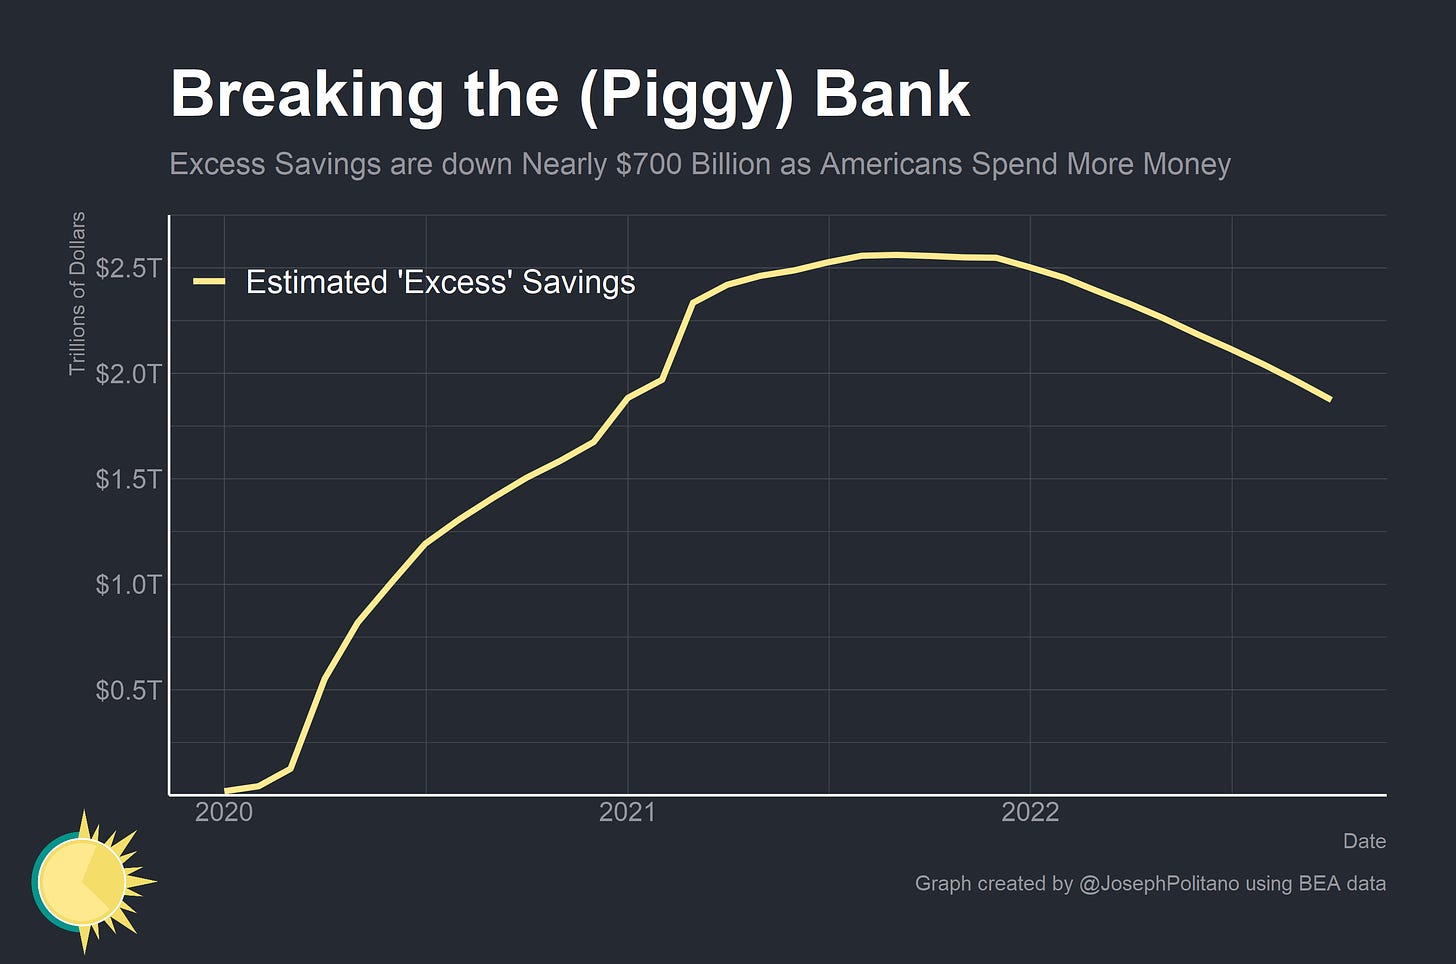
In addition, the “excess savings” that American accumulated throughout 2020 and 2021 are being rapidly spent down, with the sum total dropping by nearly $700B this year. Balance sheet strength has been a core driver of household demand and thereby inflation throughout much of the last two years, and the accumulation of excess savings have insulated some households from the effects of higher interest rates and worsening credit conditions.
But the vast majority of savings are still held by higher-income households, and lower-income households are seeing their balance sheets deteriorate amidst the withdrawal of government pandemic support and increases in expenses amidst inflation. Interest-rate-driven drops in financial wealth and household net worth continue to pass through to higher-income households, but this will also likely undo some of the large increases in capital gains taxes that have kept official measurements of aggregate income down. Although aggregate savings may be dwindling, aggregate wages are still increasing apace and have arguably been the clearer driver of overall spending.
COVID is Still Here
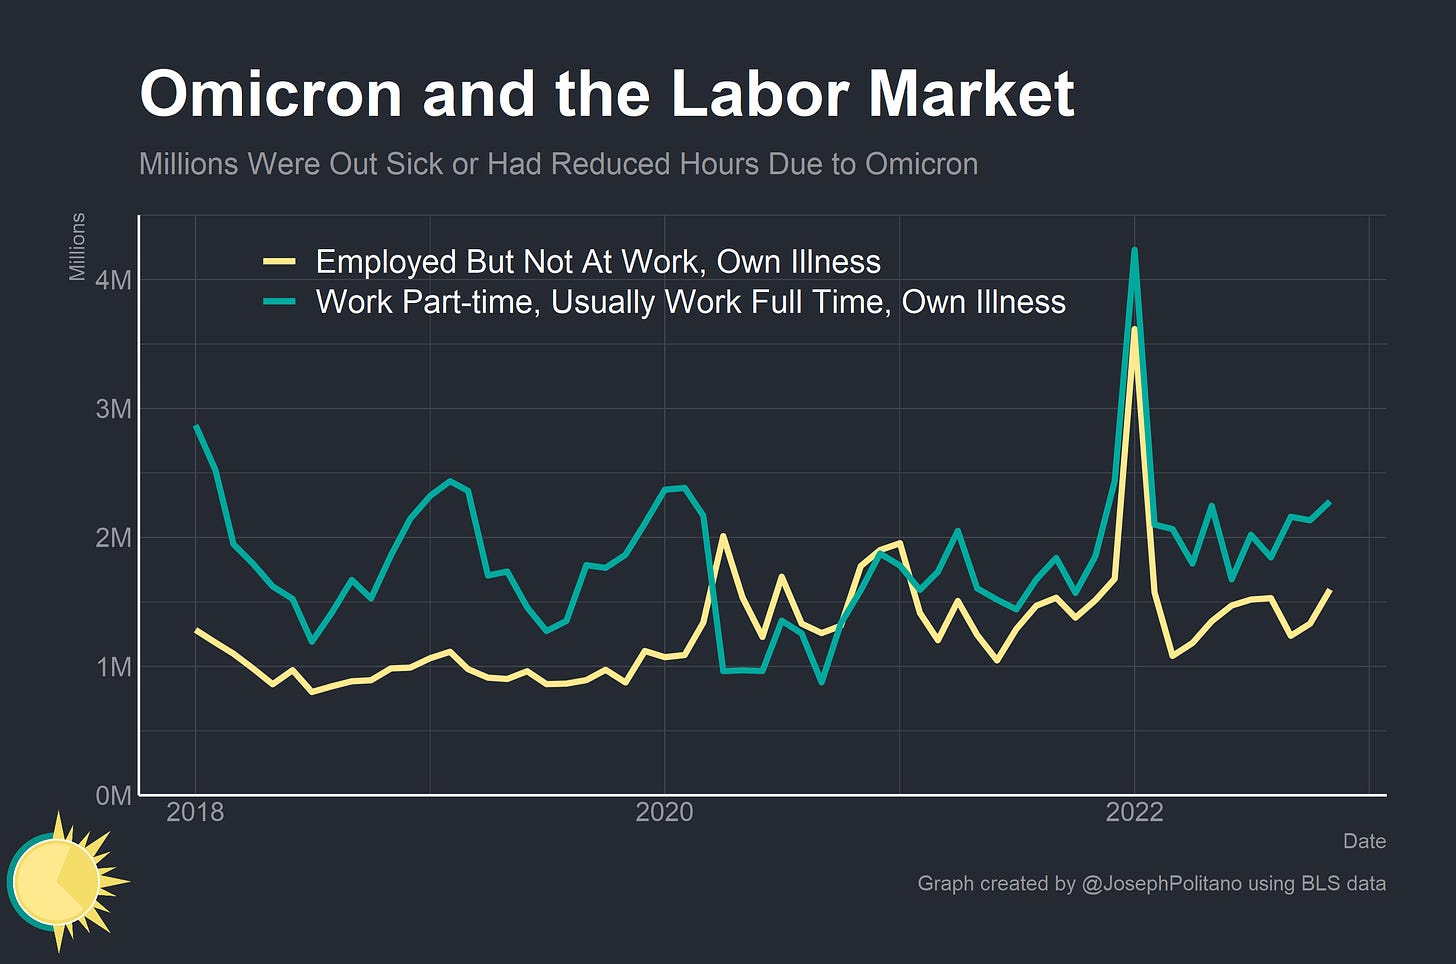
Finally, it is worth remembering that the pandemic still drives large amounts of economic uncertainty even as it becomes less of a day-to-day focus as time goes on. The number of employed people who couldn’t work for illness or childcare reasons hit a record high this year, and winter 2023 could see another surge in illness-related absences depending on how the Flu/COVID season goes. Pandemic policy in China remains arguably the biggest question mark hanging over the global economy, and the reverberations of decisions made in the early pandemic still shape the outlook today.
2023, Here We Come
Inflation has dominated the economy this year, and the economic outlook depends in large part on the path of inflation and the amount of pain required to get inflation back on track. Market-based measures of inflation expectations were put back into normal levels by the rapid increases in interest rates, but recession risks also increased dramatically at the same time. The Federal Reserve has projected a 1% increase in the unemployment rate by this time next year, something that has almost always accompanied a recession. Still, the most important thing to keep in mind is that economic outcome variance has radically increased during the pandemic—so many of the events that defined 2022, like the war in Ukraine or the highly restrictive lockdowns in China, were not easy to forecast in 2021. 2023 at least promises to be another year for the history books.


Terrific 30,000 feet view of the main drivers of our inflationary economy and my thanks to Joseph for the hard work and summary of these forces. I hope that senators, representatives and our president reads these because they are the best!
Awesome work! Who does your charts?