Thanks for reading! If you haven’t subscribed, please click the button below:
By subscribing you’ll join over 15,000 people who read Apricitas weekly!
Paid annual subscriptions are 20% off to celebrate the newsletter’s launch!
This is your last chance to get a discounted annual subscription, so act now!
Other discounts are available for students, teachers, government employees, journalists, and any groups of four or more.
Otherwise, liking or sharing is the best way to support my work. Thank you!
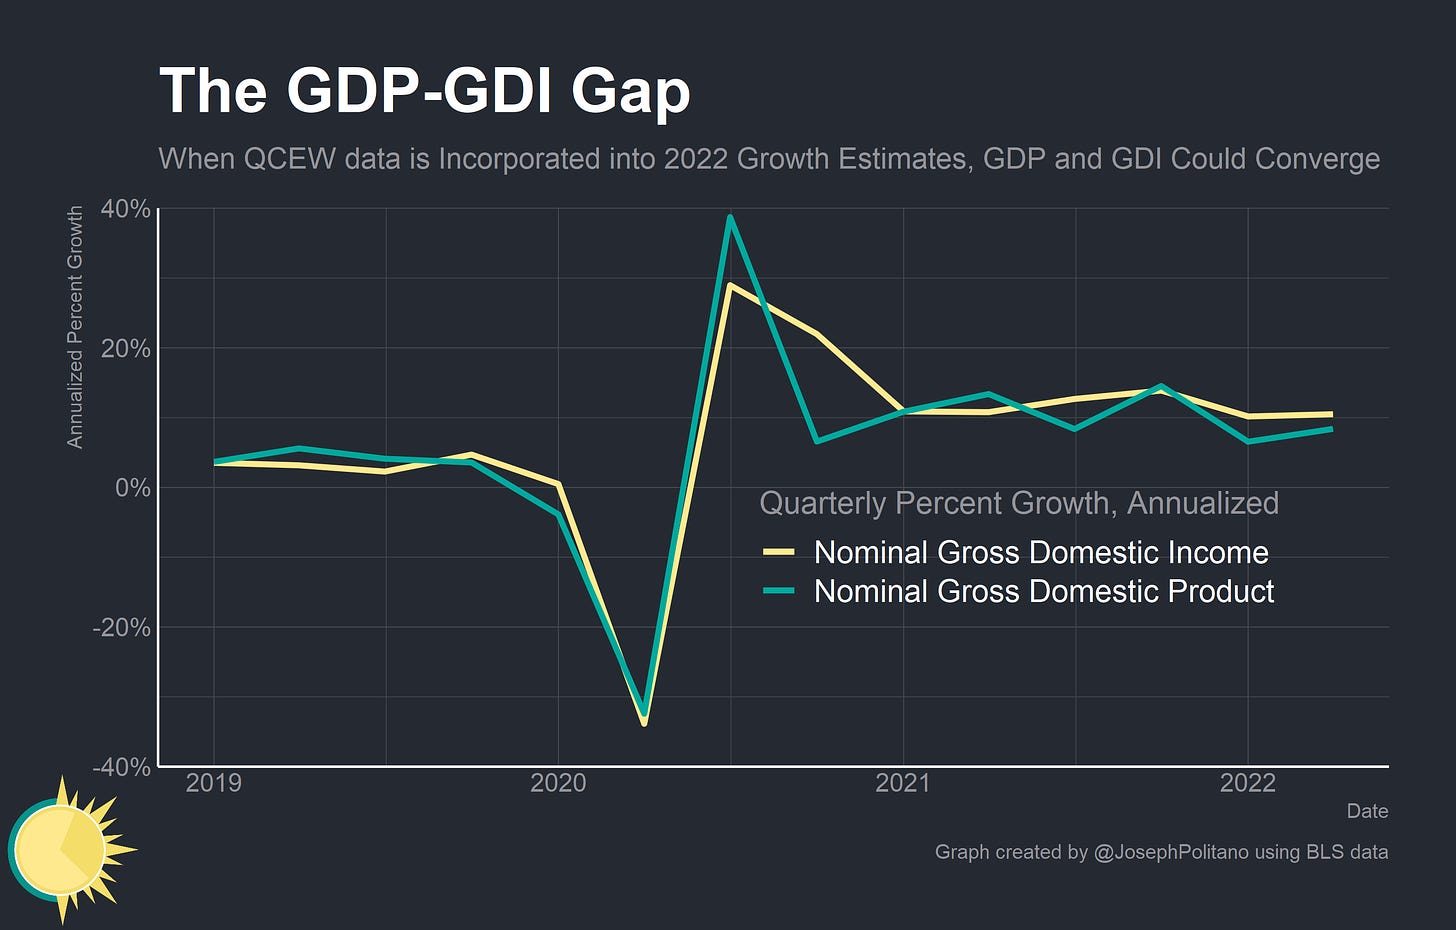
There is a trillion-dollar discrepancy in America’s national accounts. Gross Domestic Product (GDP) and Gross Domestic Income (GDI) are supposed to be equivalent measures of aggregate economic output derived from different sources and methodologies—but there is a large and growing gap between them.
When I first wrote about that gap two weeks ago, I looked into several theories for why the data could be diverging. GDP could be underestimating investment as Matt Klein has suggested, GDP could be underestimating manufacturing output and inventory growth, GDI could be overestimating corporate profits, GDI could be overestimating aggregate wage growth (the sum of all wages and salaries paid to all workers), or some combination of these factors and more.
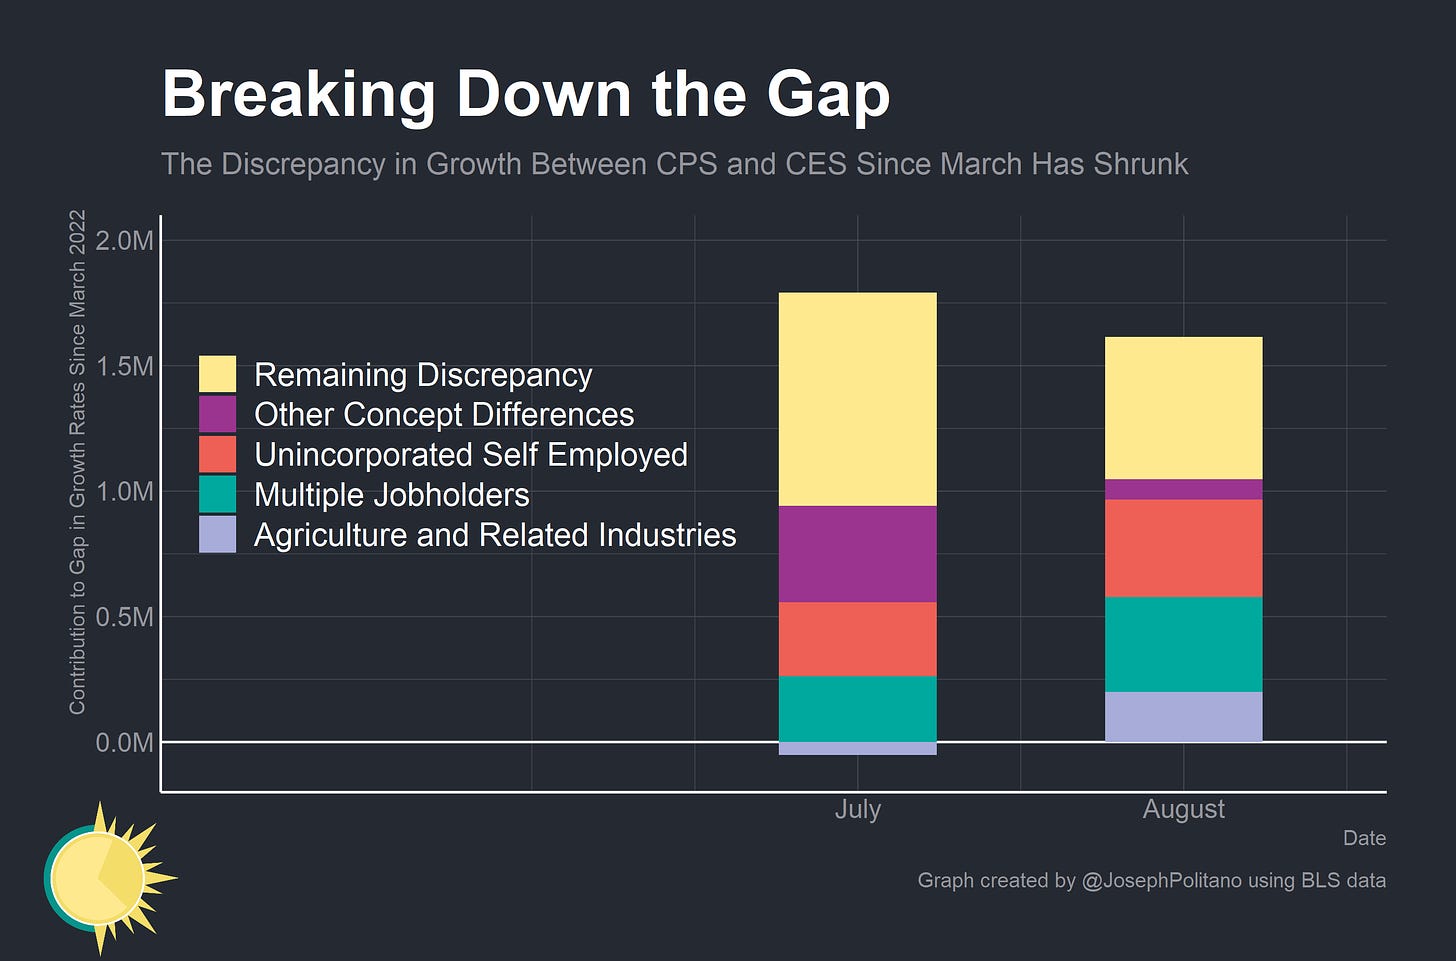
My reasoning for why GDI might be overestimating aggregate wage growth rested on the fact that employment growth in the Current Employment Statistics (CES) survey of employers had been outpacing growth from the Current Population Survey’s (CPS) household survey since March. Recent events threw some cold water on that theory—the unaccounted-for “remaining discrepancy” between recent CES and CPS employment growth since March 2022 shrunk last month due to CES revisions and additional data.
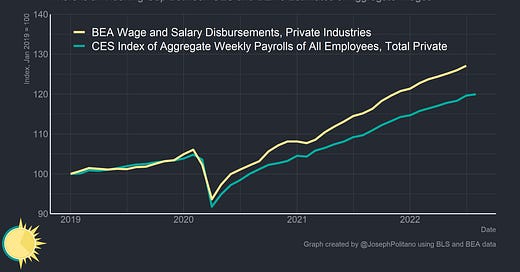
However, in a completely accidental way, I may have been on the right track. Something I hadn’t considered—but which was pointed out to me in Matt Klein’s more recent piece and by Jacobin’s Seth Ackerman—was that the GDI measurement of aggregate wages and salaries is much higher than the equivalent measurement from CES—a gap that had emerged in late 2020 and has only grown since. Right now, the Bureau of Economic Analysis (BEA)—which calculates, measures, and publishes both GDP and GDI data—estimates that aggregate wages are 6% higher than the Bureau of Labor Statistics’ (BLS) CES numbers—an amount equivalent to about $665B on an annualized basis.
That’s weird.
That’s really weird because the BEA bases its estimates of aggregate wages using data from the BLS—hence why I didn’t even consider the possibility they could diverge until it was pointed out to me that they were diverging.
So I set off to search through the data construction methodology and speak with officials at the BEA and BLS to figure out what could possibly be causing this divergence—and if they would converge sometime soon.
Sifting Through the Alphabet Soup
Before moving forward, let’s break down the alphabet soup of agencies and data sources that are necessary to understand how aggregate wage data is constructed.
The Bureau of Labor Statistics (BLS) collects data on payroll levels, hourly pay, working hours, and more.
The BLS publishes the Current Employment Statistics (CES) data on a monthly basis. CES data are collected by surveying businesses across the country on their payrolls, wages, employee hours, and more.
The BLS also publishes the Quarterly Census of Employment and Wages (QCEW) on a, well, quarterly basis. QCEW data are primarily based on businesses’ required filings for state unemployment insurance (UI) accounting systems, though it is supplemented by survey data. This makes QCEW much more comprehensive than CES, but it also means that its data is published with a 5-month lag.
CES data are benchmarked to employment levels from the QCEW at the beginning of each year.
The Bureau of Economic Analysis (BEA) uses this BLS data to construct its estimates of total wages and salaries for Gross Domestic Income (GDI).
For the most recent quarter(s), QCEW data is often not yet available. Wages and salaries are therefore initially estimated by extrapolating the previous quarter’s data using the BLS’ CES data.
BEA’s measure of quarterly wages and salaries is updated several months after the initial release to replace the extrapolation based on CES data with an extrapolation based on QCEW data.
At the start of the fourth quarter, the BEA published a comprehensive annual update for the previous year’s GDP and GDI data. As part of this, their estimated measure of wages and salaries are indexed to the QCEW’s total calendar-year measure of aggregate wages. Small adjustments are made to incorporate supplemental estimates (for unreported tips, wages not counted in QCEW, and some other income).
Hopefully, this makes it clear why I initially did not consider a gap between CES and BEA estimates to be possible. CES data are benchmarked to QCEW data, and BEA data are both derived and updated using QCEW data—theoretically, the discrepancy between CES and BEA data should only represent the small gaps between CES and QCEW and the small adjustments that BEA does to QCEW. So why the massive, unexpected divergence?
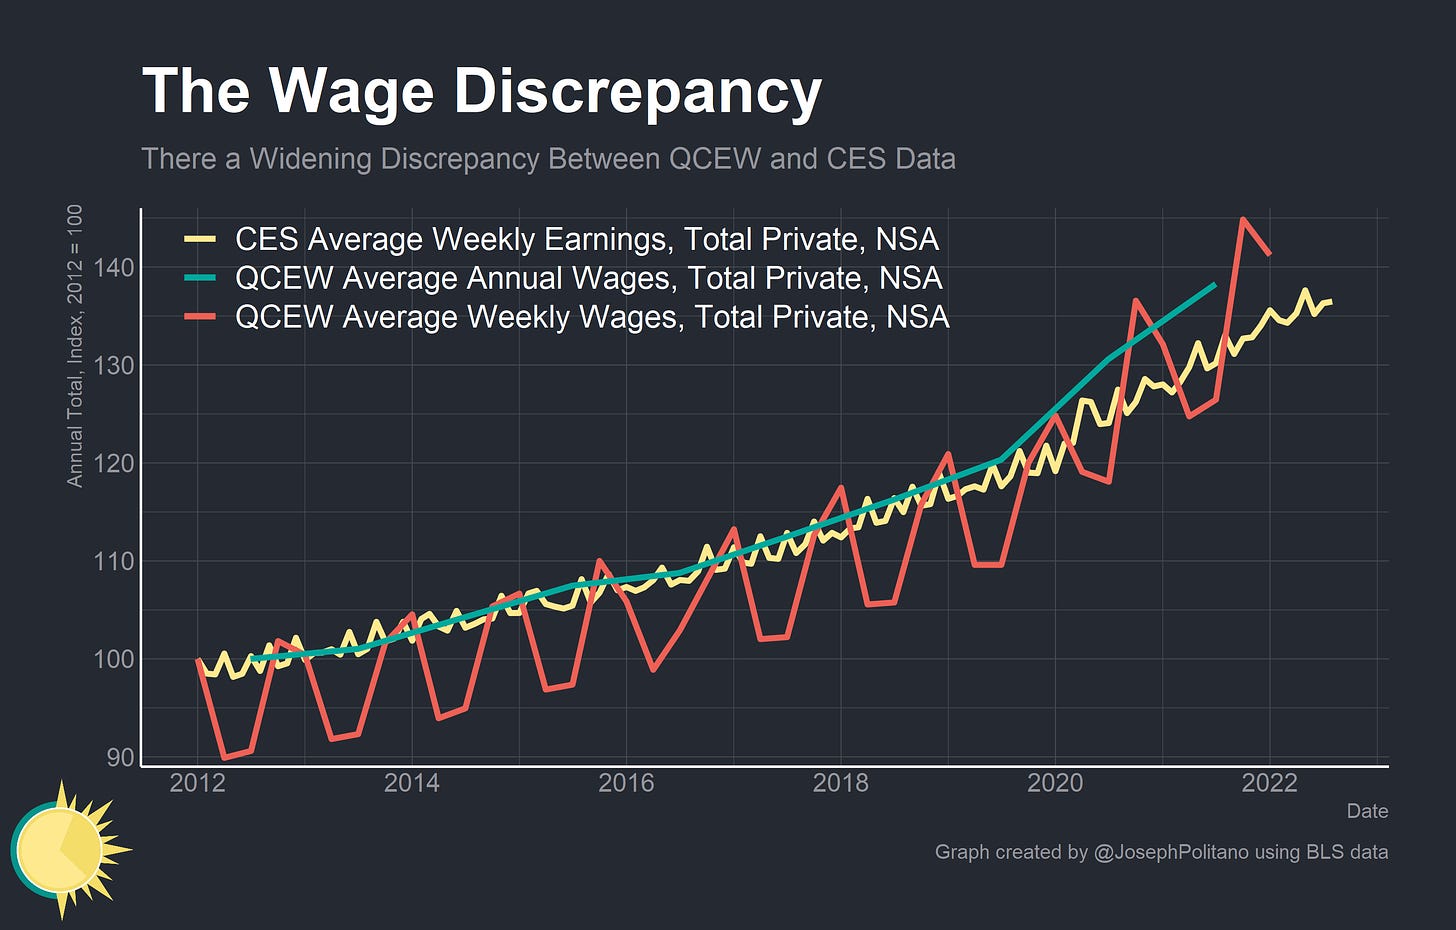
The key piece of the puzzle is that CES data is only benchmarked to QCEW using employment levels—so while the CES and QCEW estimates of total employment remain close, their estimates of wages have completely diverged. QCEW is recording average annual and weekly wage levels that are now significantly higher than CES.
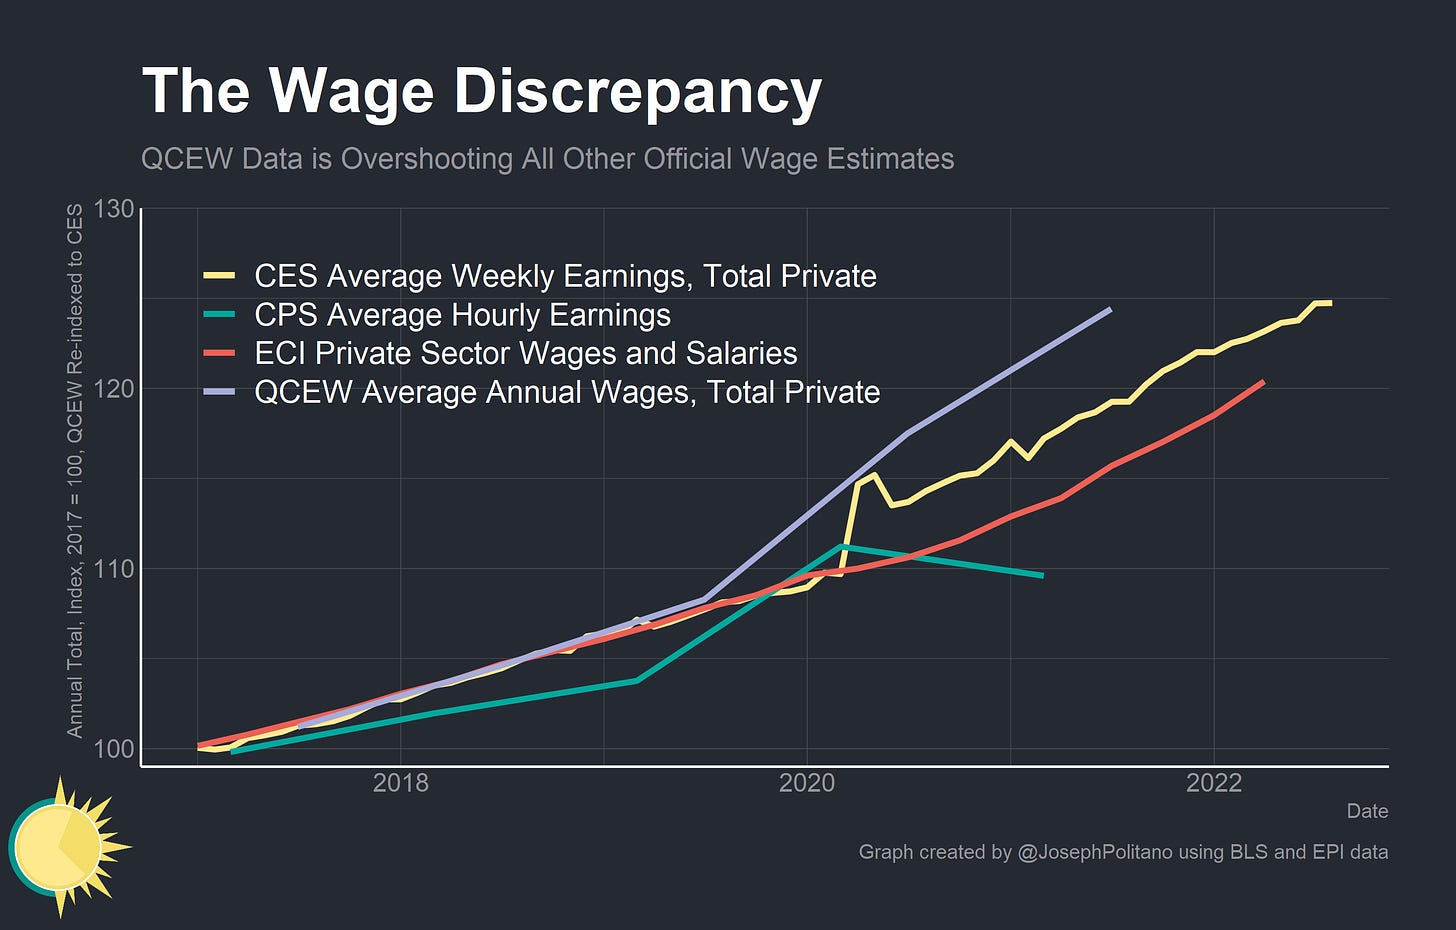
In fact, the estimates from QCEW are outpacing basically all other official estimates of wage growth—the CES data, BLS’s Employment Cost Index, and worker survey responses to the Census Bureau’s Current Population Survey. That’s really weird—QCEW data should theoretically be the most accurate and reliable estimate since it is derived from comprehensive UI administrative records that firms have large financial and legal incentives to file accurately. So I dug deeper into the methodology, and believe I have found the culprit for QCEW’s higher estimates of wage growth.
Under most state laws or regulations, wages include bonuses, stock options, severance pay, the cash value of meals and lodging, tips and other gratuities. In some states, wages also include employer contributions to certain deferred compensation plans, such as 401(k) plans.
BLS, QCEW Overview (emphasis mine)
In its estimates of wage growth, QCEW includes a host of ancillary, more irregular payments—namely bonuses, severance, stock options, and the like—that are not included in CES or most other estimates of wages. QCEW does this for good reason—after all, a bonus is still a payment to a worker even if it doesn't raise that worker’s hourly earnings—but it fundamentally means that QCEW data can diverge from CES data or other measures of aggregate wages that do not take bonuses and the like into account.
When I reached out to BLS officials about whether this difference in definitions could be driving the QCEW-CES divergence, this is what they said:
The differences are mostly due to what is cited below-concepts that are included in QCEW (bonuses, stock options, severance pay, etc.) are excluded in CES earnings data. This would essentially lead to more wages being in scope for QCEW outputs than what are in scope for CES outputs, while considering that the inputs (survey data) for both programs come from different sources (surveys) and methods.
BLS QCEW Economist
So theoretically QCEW aggregate wage estimates could diverge from similar CES estimates if a higher share of overall income came in the form of these benefits and irregular bonuses. There’s some good reason to believe this is happening—the layoffs in 2020 disproportionately affected low-wage workers, who are unlikely to have significant bonuses or stock options. Large overall layoffs in 2020 may have also triggered a wave of severance payments, and the labor shortage of 2021 may have triggered a follow-up wave of signing bonuses (job hunting website Indeed estimates that more than 5% of openings on the site now offer a signing bonus, up from less than 2% before the pandemic). A strong tech/financial sector and the rising stock market in 2021 may have boosted the value of employee stock options and led to larger bonuses across Wall Street and Silicon Valley. It would be unprecedented if the combined relative increase in these irregular compensation items amounted to hundreds of billions of dollars, and there’s no way to know for certain what’s causing the QCEW-CES gap, but this explanation seems much likelier than the alternative that official data is dramatically and systematically misestimating wages.
Besides, there are a few other factors that could explain part of the BEA-CES gap. BEA’s wage estimates for 2022 are currently based on QCEW data from 2021 that has been extrapolated forward using CES data for 2022—BEA’s annual update at the end of this month will set 2021 estimates to a control value using QCEW data and recalculate Q1 growth using QCEW instead of CES. BLS has already announced that they expect to revise up CES employment levels by about 0.3% when they incorporate data from QCEW at the end of this year. Finally, there are some slight deviations in how BEA/CES/QCEW account for regular and overtime hours worked that may marginally shift estimates.1 Revisions to recent CES prints—and likely-very-small revisions to QCEW data—could also change our view of the data. All that could help bridge some more of the gap between the BEA and CES estimates.
What Does This Mean?
Unfortunately, this likely means that a possible overestimation of wages is only a partial culprit for the GDP-GDI discrepancy at best. We’re going to have to wait until the BEA’s annual update at the end of this month to get a clearer picture, but the changes to 2021 wage data are, in my estimation, unlikely to lower BEA’s estimates of aggregate wages by an amount that would close the gap between GDP and GDI.
It may, however, provide an interesting answer to the discrepancy in GDP and GDI’s growth rates that has emerged over the last two quarters. Theoretically, the only way for a permanent gap to emerge between CES and QCEW wage levels is for the relative share of worker income disbursed in bonuses and other irregular payments to permanently rise—something that, evidently, did not happen in the wake of the 2008 recession. If the relative share of worker income coming from irregular payments only rises temporarily, then QCEW growth will initially outpace CES growth and CES will then catch up to QCEW. Since BEA’s current estimates of GDI growth for 2022 are based on CES data, they could be revised downward when the CES-based estimates are replaced with QCEW-based estimates.
Those negative revisions would have to be fairly large to close the difference in growth rates from GDP to GDI for 2022—quarterly aggregate wages would have to be revised down a little more than 1% to close the 0.5% growth gap between GDP and GDI—but they are maybe within the realm of possibility. Plus, we have seen declines in equity markets, slowdowns in the tech sector, and companies expressing more fear of a recession—all of which could plausibly have led to a relative decrease in the value of stock options, bonuses, and other irregular payments. If 2022 GDI data is revised significantly downward when QCEW data is incorporated, it would help square the circle of declining output in 2022 alongside rising employment—the downward shock to labor income may have manifested as shrinking bonuses rather than falling employment.
This gap also has important implications for inflation. Looking at CES data in 2021 would have given the impression that wage growth was weaker than QCEW estimates, but likewise a hypothetical convergence between the two data series could mean that CES data in 2022 may be giving the impression that wage growth is stronger than QCEW will say. It is still far, far too early to determine whether that will be the case with any level of certainty—but it is a critical dynamic to watch out for as the Federal Reserve tries to contain wage growth in order to combat inflation.
Conclusions: ¯\_(ツ)_/¯
Unfortunately, we still simply don’t fully know what’s contributing to the GDP-GDI gap. BEA’s annual update coming at the end of this month should provide some additional clarity—but keep in mind that much, much more than wage data will be updated at this time. The closing of the GDP-GDI gap, if it happens, will likely require a number of data series to be revised and updated with new information.
Still, it is another critical reminder of the importance of understanding how data is constructed before attempting to draw conclusions from that data. Anyone looking at BEA’s wage and salary estimates over the last two years would have drawn an extremely different conclusion about the state of the economy than someone who had looked at BLS’s data or other measures of the same concept. It is always essential, wherever possible, to double-check data sources and try to work with the most conceptually robust estimates before rushing to conclusions.
I want to thank the officials from the BEA and BLS who were extremely patient, thorough, and helpful in helping me understand their data, and I take responsibility for any possible errors I have made in recommunicating their information.
For those curious, BEA data is based on production and nonsupervisory hours instead of total hours, and CES data only counts overtime hours for manufacturing workers (though it incorporates all overtime pay into its estimates of average wages). QCEW should account for all overtime worked across all industries.




Amazingly comprehensive analysis of the discrepancies between GDP and GDI and thanks for your hard work!
Hi Joseph,
super informative article, thank you! I am trying to get to the 665B annlualized number but not sure how. I see wages and salaries in the Q2 GDP report for 11,108.4 (in billions). So do I need to come up with 10,441 (in billions) from CES establishment data somehow?