The Core Story of American Inflation
Plus: The Sub-Categories the Fed is Most Focused On
Thanks for reading! If you haven’t subscribed, please click the button below:
By subscribing you’ll join over 21,000 people who read Apricitas weekly!
Otherwise, liking or sharing is the best way to support my work. Thank you!
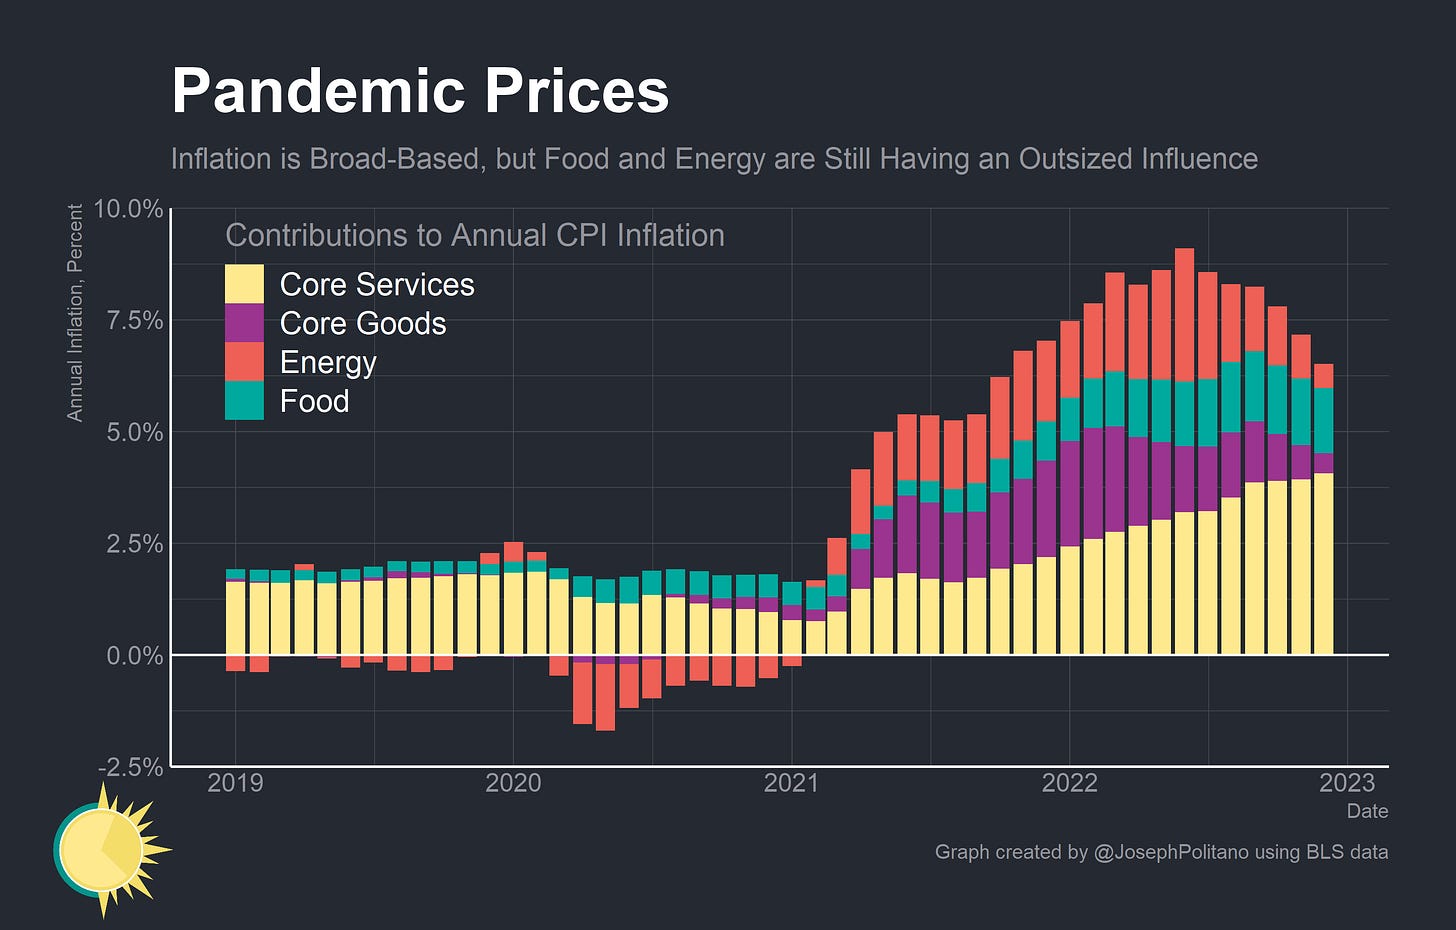
Inflation in the US continues to take a welcomed reprieve—driven by falling gasoline and used car prices, the Consumer Price Index (CPI) grew less than 6.5% over the year ending December, the slowest pace since October 2021. Critically, the makeup of US inflation has changed drastically over that time period—going from being mostly driven by supply-side shocks to food, energy, and core manufactured goods to being driven almost entirely by the combination of food and more demand-driven cyclical prices for core services (which includes housing).
Indeed, core services represented nearly all of the positive contribution to monthly inflation in December—just barely not enough to offset the massive negative monthly contribution from energy and the small negative monthly contribution from core goods. The price declines in energy and goods are a positive sign for the US economy—mostly reflecting improved supply situations in motor vehicles, fossil fuels, and other tradeable goods, but for the same reason that American monetary policymakers (generally) ignored these prices on the way up, they will be also be ignoring them on the way down. More relevant to them is the extremely high growth in core services prices—the more cyclically-driven items which are up more than 7% over the last year, growing at the fastest pace since 1982. In particular, being cognizant of the lags in official measurements of housing prices, Federal Reserve officials have emphasized the importance of prices for “core services ex-housing,” which they believe give a more up-to-date picture of the wage-driven parts of inflation that must come down to ensure long-term price stability. Even as headline inflation falls, they will not believe their job is done until core services inflation returns to normal levels.
Headline Improvements
First, it’s worth dissecting some of the non-core prices that are pulling down headline inflation—starting with energy, where the big story is that gas prices were down $2 a gallon from their summer highs. In fact, gas prices actually are detracting from headline annual inflation—the current net positive contribution from energy is driven by utility gas, electricity, and a select few other categories. Even there, relief seems to be on the way—spot prices for natural gas, critical both as a direct household utility and the largest source of American electricity, have been falling amidst warm American weather and are now below their levels from this time last year. Even with the reopening of the Chinese economy, energy looks to soon become a net negative contributor to year-on-year US inflation barring another big market-moving event.
We’re also continuing to see declines in used vehicle prices as American auto production recovers from the semiconductor shortage. Used vehicles are 10% cheaper than they were at the start of 2022 and 8.8% cheaper than they were this time last year while new vehicle prices ticked down slightly for the first time since January 2021. The outlook from here is a bit less clear, however—Manheim’s used vehicle index shows wholesale prices stabilizing in recent months while Black Book data shows prices declining at a slower rate. Still, automakers are definitely feeling some pressure to lower their prices—earlier this week, electric vehicle maker Tesla announced a series of price cuts on different models ranging from 6% to 20%.
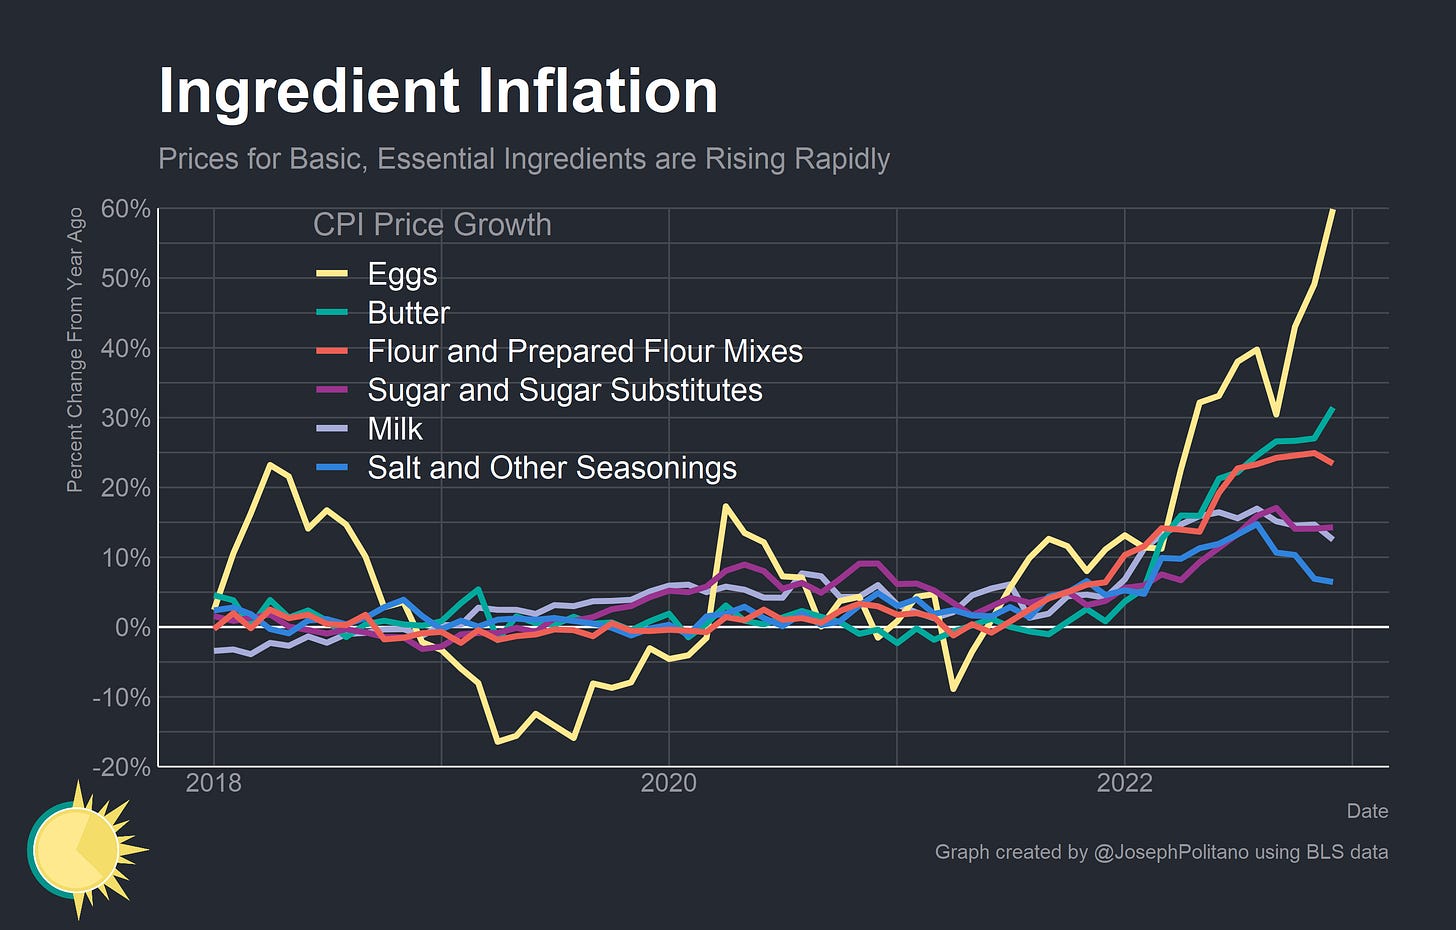
Food supply continues to be a sore spot, though, as the aftershocks of the Russian invasion of Ukraine work their way through global food markets and specific supply crunches hit American farmers. Prices for food are up 10.4% over the last year, and prices for food at home (which mostly represents groceries) are up nearly 11.8%. After a 12.5% price increase over the last year, a gallon of milk is once again more expensive than a gallon of gasoline—and egg prices are up a staggering 60% as avian flu hurts American hen stocks. The USDA estimates that 57 million poultry birds have been affected by the flu so far, and chicken prices are up 14% over the last year—though they have stabilized recently.
Meanwhile, rent prices continued their meteoric rise by increasing nearly 0.8% over the last month and more than 8.3% over the last year. Given the lags present between CPI data and new leases, peak housing inflation looks to be sometime in Q1/Q2 of 2023, but data on new leases from ApartmentList and Zillow is confirming that rent growth is cooling back to about normal levels. In fact, the year-on-year growth in ApartmentList rent data has nearly returned to pre-pandemic levels, falling to 3.87% in December. However, given the lags in housing data and the supply-driven nature of food, energy, and goods prices, the Fed is partially focusing on a different set of prices to gauge its success in fighting inflation: core services ex-housing.
The Fed’s Focus on Core Services Ex-Housing
Finally, we come to core services other than housing. This spending category covers a wide range of services from health care and education to haircuts and hospitality. This is the largest of our three categories, constituting more than half of the core [Personal Consumption Expenditures (PCE) Price] index. Thus, this may be the most important category for understanding the future evolution of core inflation. Because wages make up the largest cost in delivering these services, the labor market holds the key to understanding inflation in this category.
Jerome Powell, Speech at The Brookings Institution, November 30th 2022
The logic for focusing on core services prices is simple: they are the vast majority of household budgets and domestic production, are mostly nontradeable domestically-produced items and so are less vulnerable to international shocks, and unlike food and energy are not especially volatile. Critically, wages are both a major demand-push and cost-pull driver of services inflation: higher wages raise the costs for labor-intensive services like haircuts or childcare while also buoying demand for housing. Excluding housing from services, however, comes with some benefits and some drawbacks. The advantage is that you are excluding a noted lagging indicator—ostensibly, core services ex-housing should provide a more real-time view of core price pressures. The drawback is that you are excluding one of the most robust and reliable demand-push indicators—perhaps giving a better view of the cost pressures felt by restaurants but missing the demand pressures put on housing by restaurant workers. The flaws go deeper too, with some components of core services ex-housing containing very little information on the current state of the economy or forward outlook for inflation. Still, core services ex-housing are extremely important—and in the Fed’s favored personal consumption expenditures price index they make up more than 1/2 of the total basket—and so they’re worth dissecting in detail, especially as Fed officials emphasize their centrality to monetary policy decisionmaking.
Keep reading with a 7-day free trial
Subscribe to Apricitas Economics to keep reading this post and get 7 days of free access to the full post archives.


