The Inherent Flaws in Inflation Measurements
Inflation is Hard to Measure, But Harder to Ignore
The views expressed in this blog are entirely my own and do not necessarily represent the views of the Bureau of Labor Statistics or the United States Government.
Unfortunately there’s no single way to measure the value of money. When we describe the value of other goods, we typically use money as a sort of measuring stick. But as soon as money itself becomes the item of interest, things get more confusing.
Scott Sumner, The Money Illusion
Inflation, like many ideas in economics, is a seemingly simple concept that betrays extreme empirical and theoretical complexities. In theory, inflation is the rate of change in the price level, which itself is a measure of the value of money. When inflation occurs, the same amount of money can purchase less stuff. So to measure inflation, just take a measurement of the prices of all the stuff in the economy weighted by consumer spending and compare prices across time periods to see how the value of money has changed.
In reality, there is no way to perfectly measure inflation or craft a perfect theoretical price index. On the theory side, constructing an index of all spending in the economy requires a somewhat discretionary approach to defining a representative “consumption basket” and redefining that representative basket across time periods. It is impossible to perfectly condense heterogenous prices for heterogenous goods and services into a single price index. Investment items (like homes) must have their rental prices imputed indirectly, and statistical agencies must always make tough choices at the margins on specific statistical methodologies. Goods and services have to be adjusted for a myriad of quality aspects across time, which is extremely difficult to do when the products themselves are evolving.
Empirically and practically, constructing inflation indexes involves imperfect surveys of prices alongside imperfect adjustments and imperfect imputations. Some component prices are well-tracked and empirically sound, while others are poorly tracked and empirically weak. Prices are sometimes nonexistent or administered in unorthodox ways that make it impossible to even measure a single unified price for a given transaction. It is nearly impossible to isolate short term relative price fluctuations from long term shifts in the price level as both are happening concurrently and influencing each other. Idiosyncrasies in businesses’ pricing behavior also play a critical role in distorting inflation measurements.
Nevertheless, measuring inflation is one of the most important parts of macroeconomics. The value of money determines so much of consumers’, producers’, investors’, and governments’ behavior that it simply cannot be ignored. The fact that inflation is impossible to perfectly measure betrays the importance in measuring it as well as possible. Instead of throwing inflation out, we should make sure to always be looking under the hood at the underlying price and non-price dynamics to inform our understanding of the economy. Instead of focusing on one measure of inflation we should check with different aggregation methods of the information that makes up inflation. When designing policy and making choices, we should readily acknowledge the inherent flaws in inflation measurements and refocus on other measures of the economy.
The Importance of Indexes
As mentioned before, inflation indexes are constructed by taking a basket of goods and services and comparing them across time. However, taking a basket of prices over time is an inherently imperfect measure of inflation because the weights of the basket, items in the basket, and prices of of these items are all varying simultaneously across time. A price index’s basket, scope, and methodology can therefore have substantial effects on its measurement of inflation.
The Consumer Price Index (CPI) is the most popular price index for the United States. It captures headlines every time it is updated and has vast financial markets dependent solely on its readings. That’s why it might surprise you to learn that the CPI is not the preferred price index of the Federal Reserve, the nations premier inflation-managing institution. Instead, the Federal Reserve uses the Bureau of Economic Analysis’s Personal Consumption Expenditures Price Index (PCEPI).
CPI is Lesperyes indexes, meaning they measure a basket of prior goods in today’s prices, versus a Paasche index that measure’s today’s basket in prior prices). PCEPI is a Fisher index, meaning it chains together the geometric mean of changes in the Lesperyes and Paasche indexes. The core structural difference is in scope and weights, although there are some methodological differences. Essentially, the CPI is designed to only reflect the prices faced by consumers in their purchases with discretionary income while the PCEPI is designed to reflect all prices in the economy. CPI therefore underweights healthcare to a significant degree (as many healthcare expenses are covered by employers or governments) and overweights other items (like housing) when compared to PCEPI. The other critical difference is that PCEPI is a chain-type price index, meaning it accounts for the substitution effect that occurs during relative price increases. In theory this means it would discount a relative price increase in potato fries under the assumption that consumers would respond to the price increase by shifting consumption somewhat to sweet potato fries. Finally, PCEPI bases their weighting and prices on actual spending in the economy as opposed to the CPIs emphasis on weights from the Current Expenditures Survey and sticker prices (although it should be noted that PCEPI borrows many of its component price indexes from CPI).
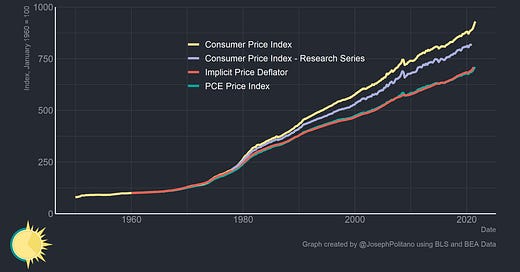
In practice, CPI is not a good measure of inflation—especially over the long run. Since it focuses on a subset of items with higher relative price increases and does not account for substitution, it tends to run approximately 0.3% ahead of PCEPI. PCEPI closely matches the Implicit Price Deflator (IPD), another inflation metric that captures price changes throughout the economy, while CPI increases far faster. Even the CPI Research Series, which updates older CPI measurements with newer methodologies, runs ahead of PCEPI and IPD. Wherever possible, PCEPI should be used as the superior inflation measure simply because it much more accurately reflects total changes in the value of money. Huge errors are often made by adjusting the value of money from the distant past using flawed measurements like CPI.
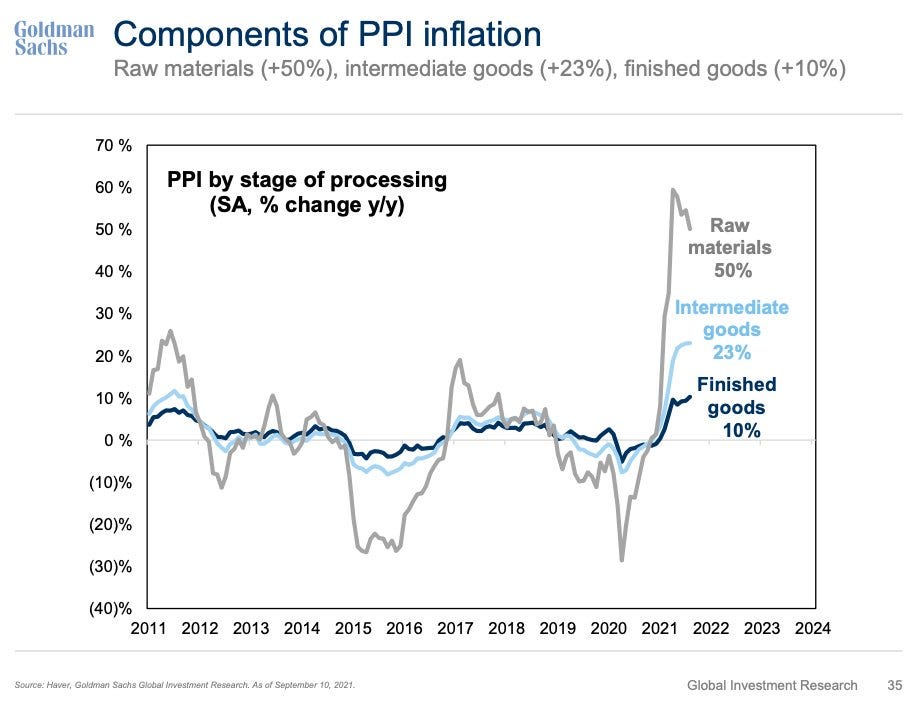
In addition to traditional metrics of inflation, there are alternative measures of inflation that track entirely different worlds of prices in the economy. The Producer Price Index (PPI) measures selling prices of domestic producers as opposed to the PCE and CPI’s method of measuring prices faced by buyers. As a result of the domestic-only sampling and other important distinctions (including a complete exclusion of imputed rent from PPI), the index fluctuates dramatically compared to PCE or CPI.
The Employment Cost Index (ECI) measures the costs of labor across time for firms within the US. The index is among the best representations of nominal compensation growth, as unlike other measures it accounts for compositional changes in employment across time and includes non-wage benefits like employer-sponsored healthcare. When the BLS’s median wage metrics spiked during the pandemic, ECI instead showed a decline in the compensation growth rate. Median wage metrics were increasing as a result of low-income workers disproportionately losing their job, something ECI adjusted for.
PPI and ECI are useful in their own rights, but it would be disingenuous and improper to use either as a measure of the dollar’s value. PPI excludes imports and includes exports, both of which distort the sampling so much as to make it non-representative. That is not even to mention the exclusion of a large number of services from PPI. ECI’s measurements of nominal compensation growth inherently account for real wage growth, meaning it tracks changes in output alongside changes in the price level.
Another critical aspect of inflation is its volatility. Because relative price increases are always occurring alongside general price level shifts, dramatic shifts in a limited selection of goods and services can have a massive effect on headline inflation. When oil prices tanked in 2014/2015 it drove headline inflation nearly to zero, and current transitory pandemic shortages have driven inflation to the highest rate in recent history. In the long run, headline inflation is what is most important, but it is only by constructing a “core” inflation index that we can determine whether inflation is a general persistent phenomenon or the result of temporary sectoral imbalances. So how do we get rid of volatile components?
Official core PCEPI eliminates food and energy prices, which historically have been some of the most volatile categories within the index. However, static exclusion of certain sectors can never truly isolate “core” inflation as the sectoral price shifts are never guaranteed to be restricted to the same couple of sectors. Instead, median PCEPI and Trimmed Mean PCEPI represent the best ways of eliminating volatility. Median PCE takes the price growth of the weighted-median index component, while Trimmed Mean PCE eliminated the components that have increased and decreased the most, with a greater proportion of the increases eliminated. This is to account for the skewness in the distribution of price increases among PCE components and makes Trimmed Mean PCE tend to do the best overall job at estimating core inflation.
Asking About Prices
When you dig deeper into the component indexes that make up PCEPI, it becomes clear exactly how difficult it is to measure prices. Simple, fungible goods like gasoline or copper wire are easy to measure, but imagine trying to construct a price index of cell phones. Statistical agencies have to employ “hedonic adjustments” in an attempt to compare the value of an iPhone 10 vs an iPhone 7, which of course is always a partially subjective process. This is especially true when goods do not have clear specifications (like computing power, image quality, or storage space) to compare. How do you hedonically adjust the price of video games when each game is an inherently different piece of media that cannot readily be substituted? In one noteworthy case hedonic adjustments resulted in a massive drop in the telephone services price index when telecom providers switched to unlimited data plans. However, hedonic adjustments actually tend to cause overestimations in the rate of inflation as newly invented products are not normally introduced into price indexes until they have already experienced their largest quality gains and price drops.
Some components are notoriously bad, and none more so than financial services. Due to the percentage fees employed by many brokerages, fund managers, and other financial institutions, realized prices by consumers fluctuate dramatically with stock market price and volume. Many commissions are “imputed”, meaning they are measurements of costs not directly paid by consumers (zero-fee brokerages are paid to route your orders to firms looking to profit off of your trade, essentially imposing a hidden cost on traders). This is not abnormal; homeowners even have their housing costs imputed as if they were paying themselves rent, which carries its own problems. Agencies also have to draw fundamentally arbitrary lines between goods that have their purchase price tracked (cars and other motor vehicles) and investment goods (homes) or free services (commissions) that must have their prices imputed. Together, this represents a small selection of the complex price architectures that statistical agencies have to wrestle with in estimating price changes, especially for items that are nominally free.
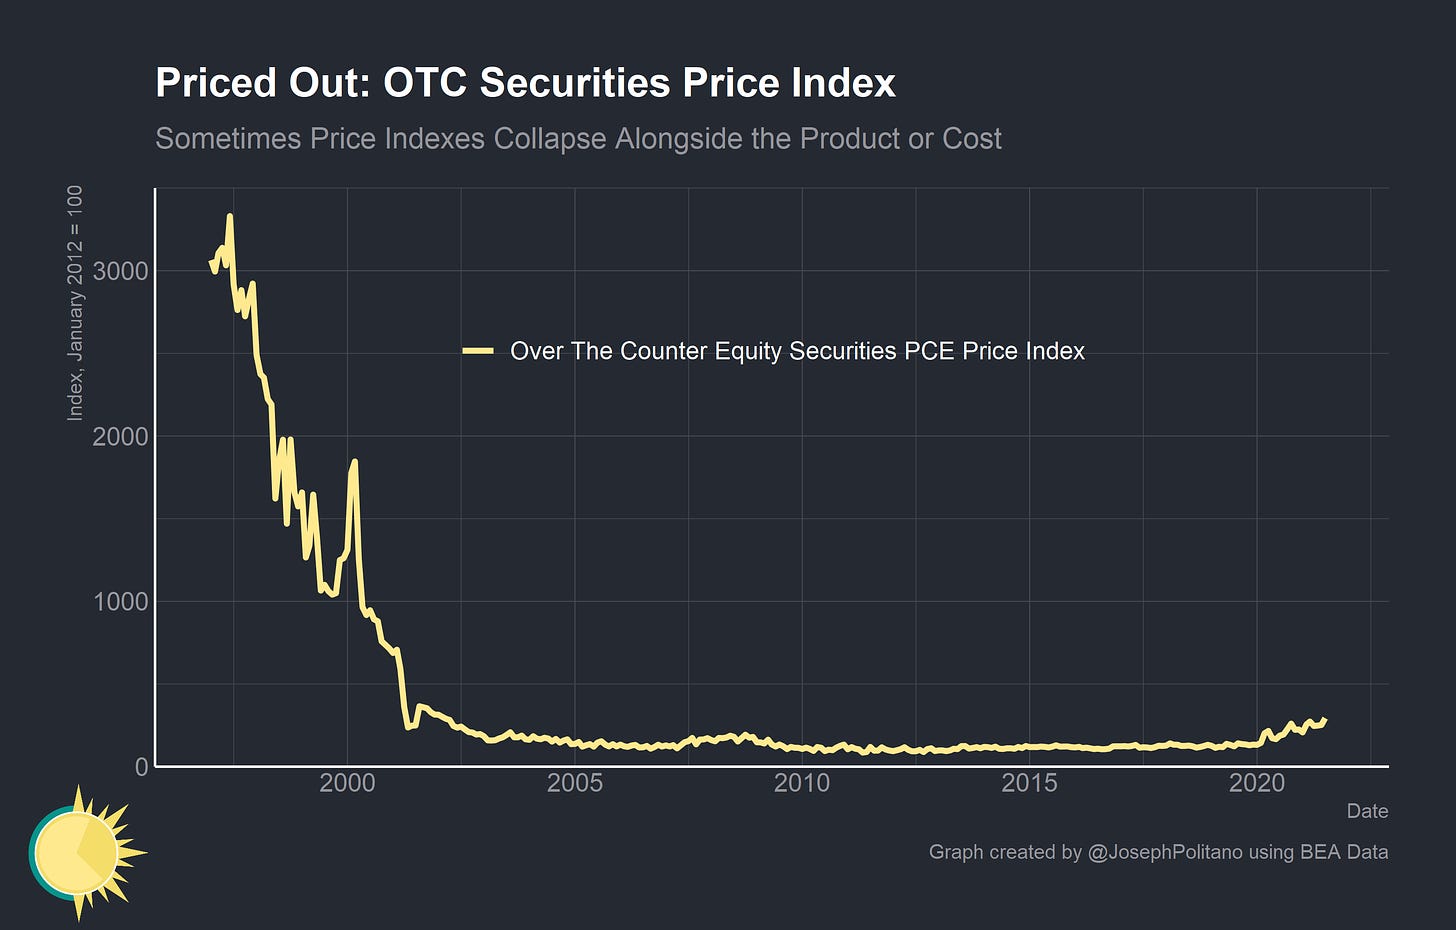
Another complication is the possibility for total collapse of industries and elimination of certain goods, services, or their associated prices. VCRs are no longer used in any serious capacity, so it becomes difficult to compare price level baskets that included VCRs to price level baskets that do not. Sometimes goods are replaced by superior versions (think USB drives replacing floppy disks) and sometimes they are completely eliminated (think fax machines). In rare cases the good may persist but its price may trend almost to zero. This was the case for “Over The Counter Equity Securities.” Since the component was introduced in 1997 OTC securities have fallen out of favor as traditional trading became more accessible, and their associated fees dropped more than 95%.
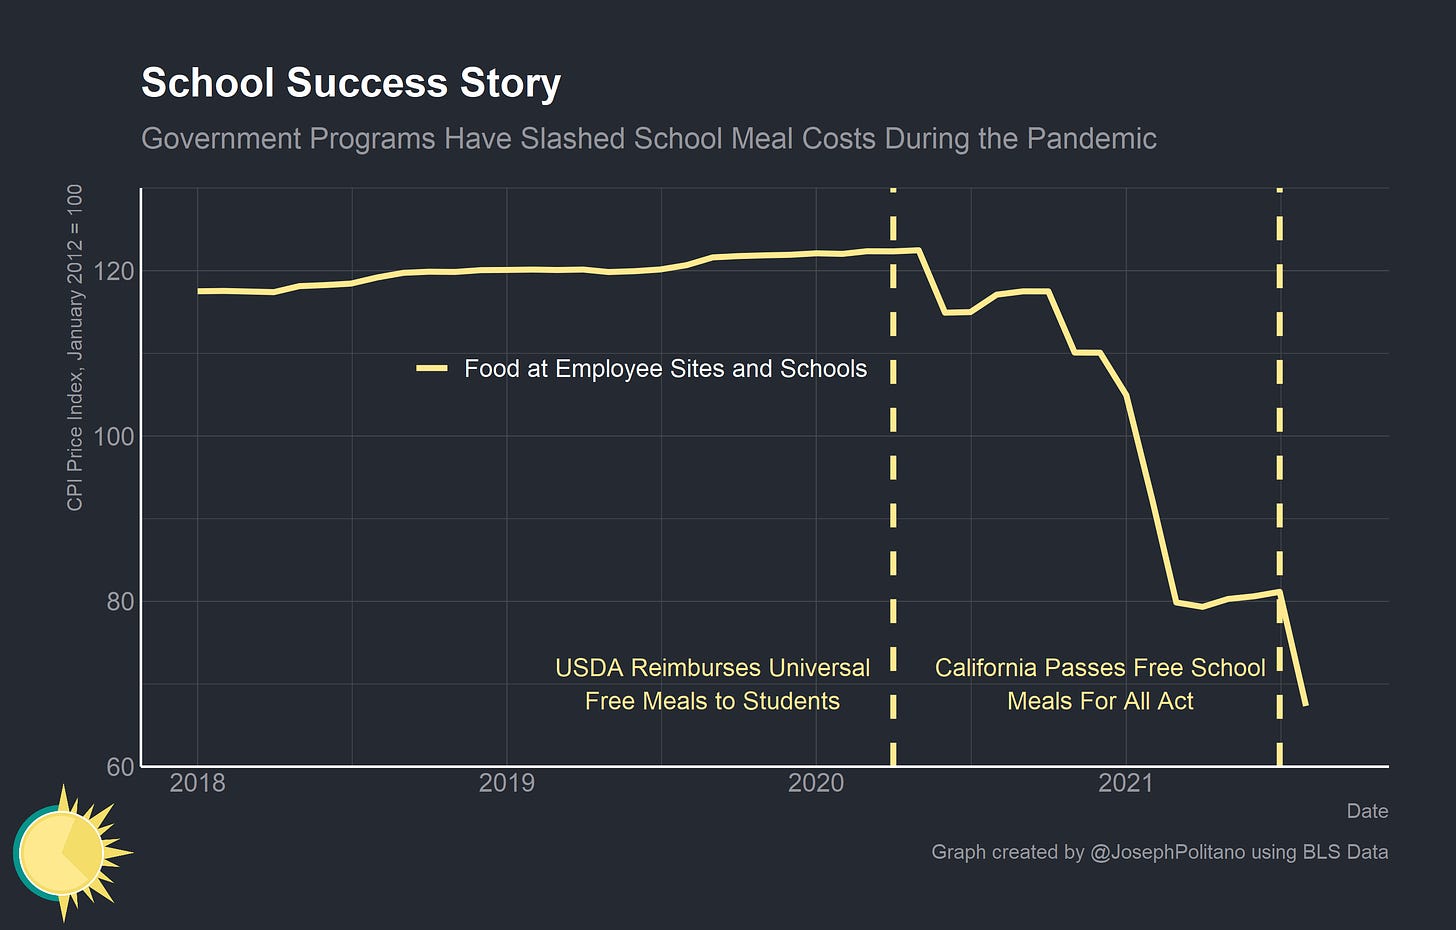
It is also important to acknowledge that the government has direct or indirect control over prices in many sections of the economy, especially education and healthcare services. Now, it is important to acknowledge that sometimes it is optimal to have rationing and non-price resource allocation, so it is not necessarily true that these price controls are hampering economic growth. However, they do make inflation measurements tricky. Recent decisions by the USDA and state of California have made free school meals accessible to millions more children throughout the Unites States. As a result, the “Food at Employee Sites and Schools” component of the CPI has dropped nearly 50%. Obviously the price of food is not down 50%, only the price faced by students now that the government is picking up part of the tab. Positive changes in government policy made the old method of measuring prices severely outdated.
In other cases, the government directly controls both the price paid by the consumer and the price paid by the government itself. Nowhere is this more true than in healthcare services. In 2014, the expiration of 100% federal funding for primary care fees from the Affordable Care Act caused a noticeable drop in prices across the healthcare industry. This year, a fee schedule increase negotiated with the Center for Medicare and Medicaid Services caused a noticeable bump in the physician services price index.
The amount of industries with some level of price controls is enormous; housing, healthcare, education, shipping (USPS), and many more. Healthcare is rather famously a sector where normal economic rules do not apply and price and production controls can actually make substantial improvements over a traditional market system, so it makes sense that the government intervenes significantly. These interventions, however, can cause market inefficiencies that manifest as quality changes that are not reflected in price indexes. If rent control stops housing prices from rising, but wait times for apartments rise dramatically, the value of the dollar has clearly decreased in a way that may not be reflected in inflation indexes.
Businesses’ Behavior
CMA CGM, one of the world’s biggest container-shipping firms, took the industry by surprise when it announced a five-month cap on spot rates for ocean freight. The cost of shipping a standard large container is four times higher than it was a year ago for a number of reasons, including congestion at ports. CMA CGM describes this as an “unprecedented situation” and is capping prices to keep its customers happy.
The Economist, September 18th-24th 2021 Issue
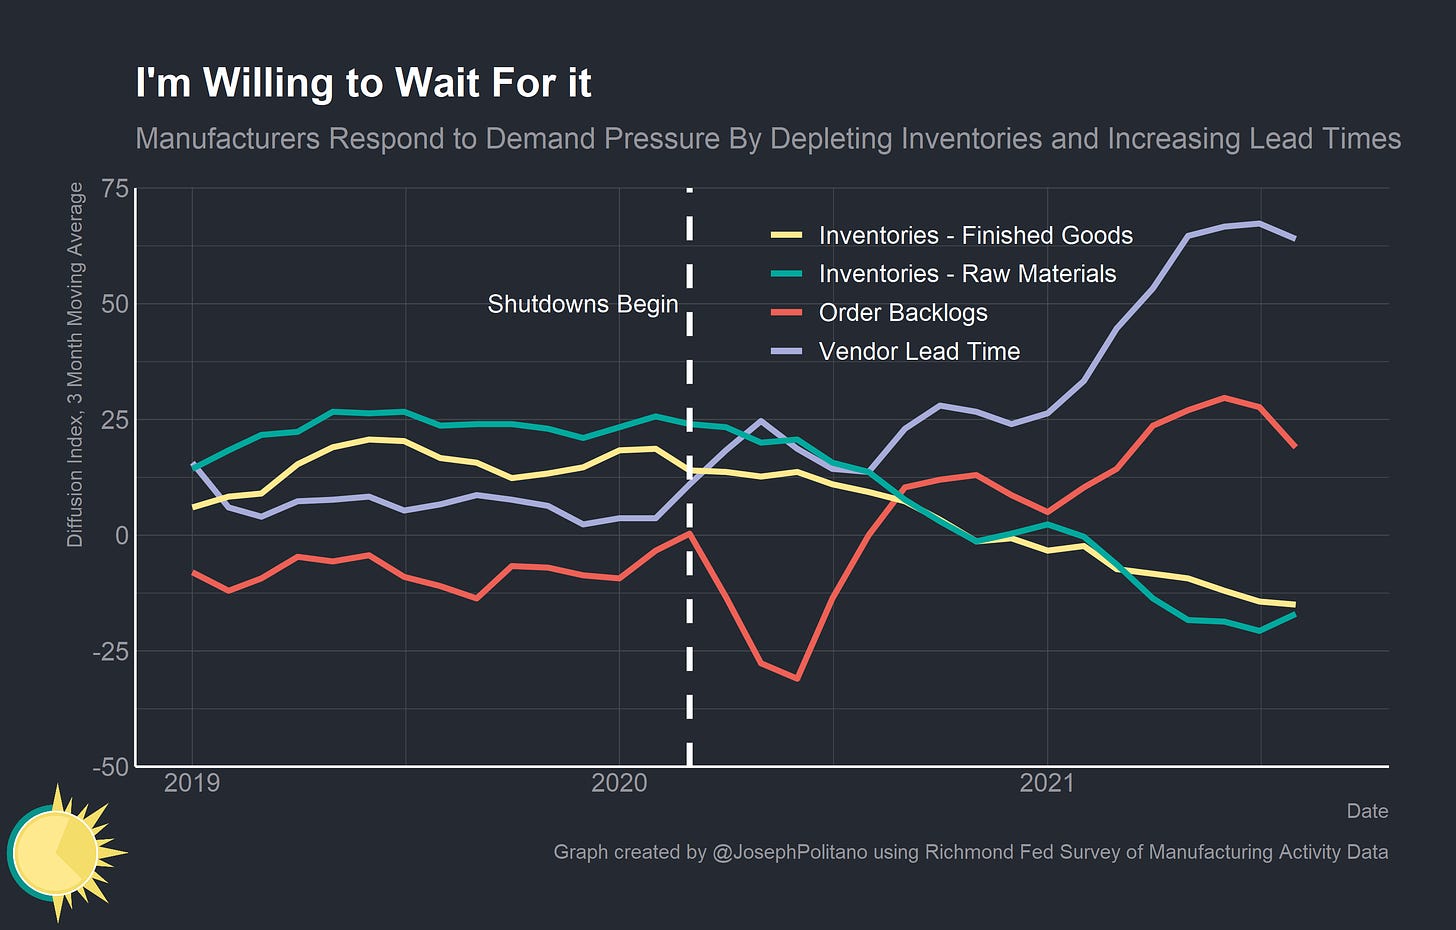
Businesses’ behavior in response to demand shocks is also critical to understanding inflation dynamics. In general, the first thing that happens when demand increases is that businesses increase backlogs, deplete inventories, and increase lead times (the gap time between order and delivery). In 2020/2021, this is essentially what happened throughout much of the durable goods market. Under extreme uncertainty, producers first depleted inventories, then increased backlogs and lead times, and finally boosted prices as a last resort. Only when prices increased did lead times and order backlogs alleviate.
This is the critical dynamic underlying sticky prices; firms are unable to rapidly increase or decrease prices in response to demand shocks because customers value transaction utility (in layman’s terms, “not getting ripped off”) and firms are often locked into contracts based on nominal values. CMA CGM is a good example, as despite being a major player in the international shipping industry they valued their relationships with customers so much that they felt unable to charge a market clearing price and instead accepted a price cap with massive order backlogs and lead times, a situation I call “waitflation.”
This is the situation at the core of today’s pricing dynamics. Producers are absorbing the rising costs of raw materials and intermediate goods and passing them onto consumers in the form of higher wait times or other quality adjustments. “Waitflation” and other subjective quality degradations are not well accounted for by the hedonic adjustments in price indexes. “Shrinkflation”, the practice of keeping prices stable but reducing product sizes, is much better accounted for but still is imperfectly measured by inflation indexes. Normally “waitflation” is a temporary phenomenon, as firms would likely attempt to raise prices to restore inventories if they believed the demand shock to be permanent. There may, however, be scenarios where binding price controls or production issues cause “waitflation” to become endemic to a certain sector (semiconductors are the current case study for production-issue-driven “waitflation”). Official measures of inflation will underestimate the drop in the dollar’s value in these cases.
Business behavior, hedging, demand shocks, and market reflexivity can also cause a self-reinforcing temporary spike in prices. This is essentially what happened with lumber prices over the summer. General demand-driven price increases mixed with supply chain issues to catch firms flat-footed. Firms that used lumber as an input rushed to hoard the good or hedge their exposure using futures contracts. This drove prices up further in a self reinforcing cycle until lumber futures prices had tripled. After the initial frenzy, prices fell back down to normal levels once the hysteria passed.
The initial demand shock was amplified through the supply chain through this “bullwhip effect.” Again, this is generally only a temporary phenomenon, but it can significantly affect month-to-month inflation prints. It should be taken as representative of the information compression inherent in inflation indexes and why you can never draw conclusions from a single inflation print. Additionally, it should be representative of the large amount of non-price effects that can manifest from changes in demand and shifts in the value of the dollar.
Conclusions
When a measure becomes a target, it ceases to be a good measure.
Marilyn Strathern
There are almost innumerable inherent flaws in inflation indexes, but that by no means indicates that they’re unimportant or uninformative. Private price trackers like the Billion Prices Project have verified the general accuracy of US government inflation indexes, which is not surprising given the herculean efforts undertaken by BLS and BEA in order to gather quality data. The big-ticket items that compose the majority of CPI and PCEPI—housing, energy, food, and transportation—are well tracked and well measured. Many of the flaws discussed here, including “waitflation” and other nonprice quality adjustments, are nearly impossible to completely theoretically and empirically account for.
Inflation remains among the only indicators of whether nominal growth is exceeding its sustainable maximum, even if it is a lagging indicator. Even though it is not a cost of living index, it does play an important role in determining the cost of living adjustments for government benefits and wage bargaining negotiations. Instead of throwing inflation out, we should focus on accompanying different inflation indexes with a series of non-price indicators like lead times, backlogs, inventories and capacity utilization. When designing monetary and fiscal policy we should center nominal income growth instead of inflation. After all, even if the Federal Reserve was inducing constant 2% annual inflation prints there is no reason to believe that the theoretical and unobservable shift in the dollar’s value would also be exactly 2%. If we instead acknowledge the inherent flaws in inflation, we can finally start using it in ways that enhance our understanding of the economy.
If you like what you read, consider subscribing to get free economics news and analysis delivered to your inbox every Saturday!





Joseph,
Firstly, great article. Secondly, I was curious what index you used for the CPI research series. I found this one on FRED: Research Consumer Price Index: All Items, Index 1982=100, Seasonally Adjusted (CPIEALL).
But the graph doesn't look like yours. Maybe I'm missing smth embarrassingly obvious here but if not, could you point me in the right direction?
So I was clicking through some of the links in this excellent article, and I got really confused by this one:
https://www.singlelunch.com/2021/09/20/inflation-is-not-cost-of-living/
First off, it's just wrong that Unlearning Economics (UE) was saying we are measuring inflation incorrectly. Instead, UE's point was that addressing inflation concerns atm means addressing supply-side issues. But this seems to be what you think too. Here's a quote from the article below "the transitory inflation we are currently experiencing is more a result of pandemic-related shortages".
https://apricitas.substack.com/p/yes-inflation-is-transitory
Am I misunderstanding you? Or did you just that article because of its discussion on cost of living vs. inflation?