The Labor Market Mystery Deepens
Official Data is Telling Two Different Stories About the Employment Recovery
Thanks for reading! If you haven’t subscribed, please click the button below:
By subscribing you’ll join over 18,000 people who read Apricitas weekly!
Otherwise, liking or sharing is the best way to support my work. Thank you!
The US labor market will play a crucial part in determining how well the global economy fares amidst elevated recession risks—and its relative strength amidst rising interest rates and massive global supply shocks throughout this year has been remarkable.
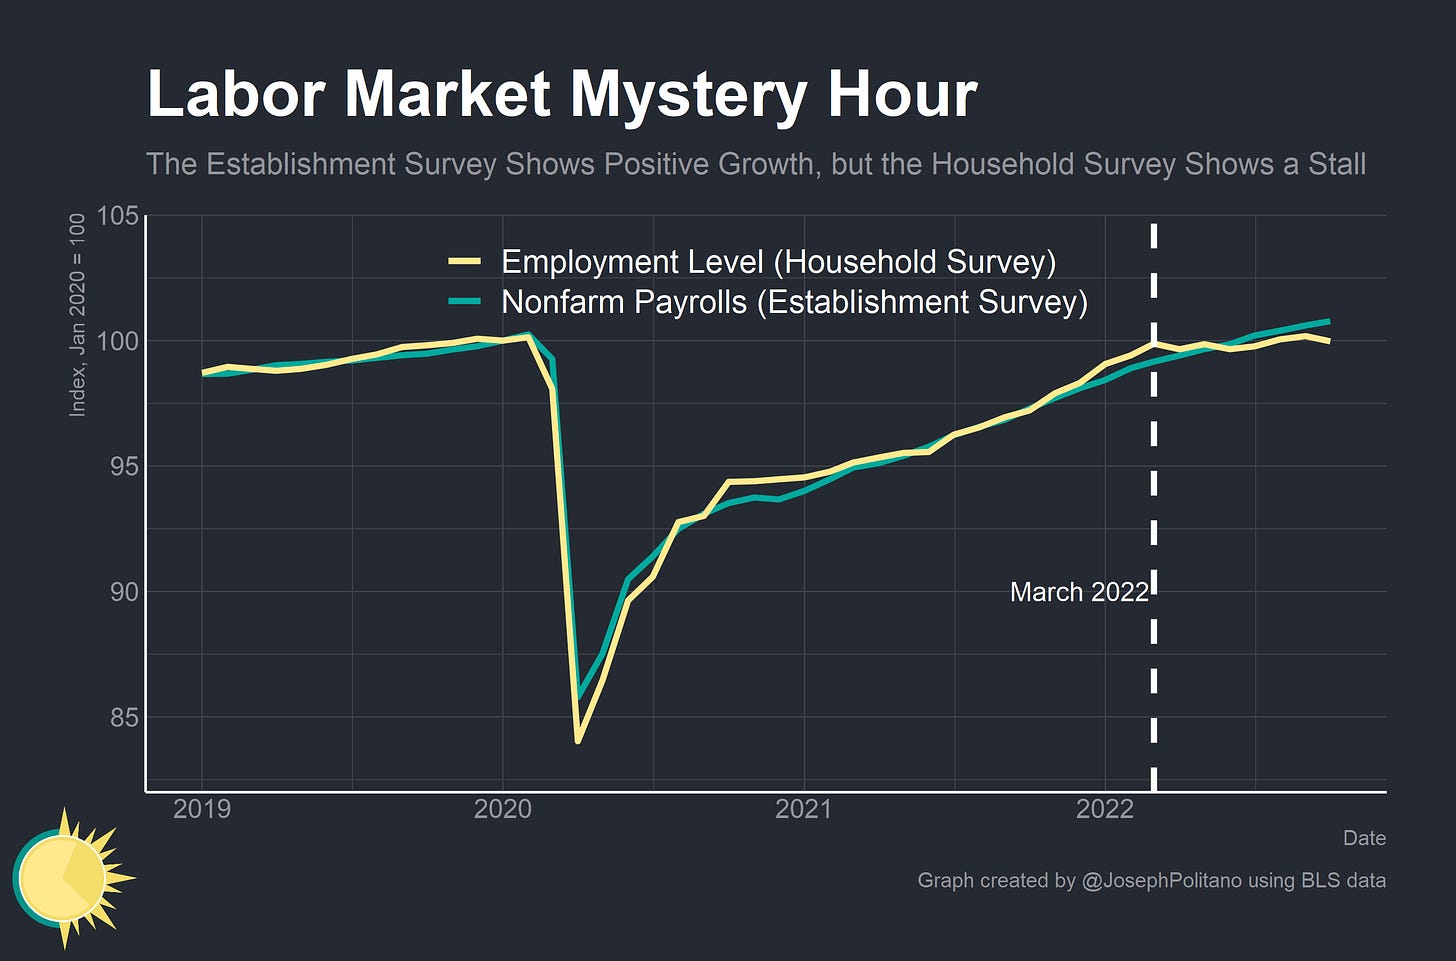
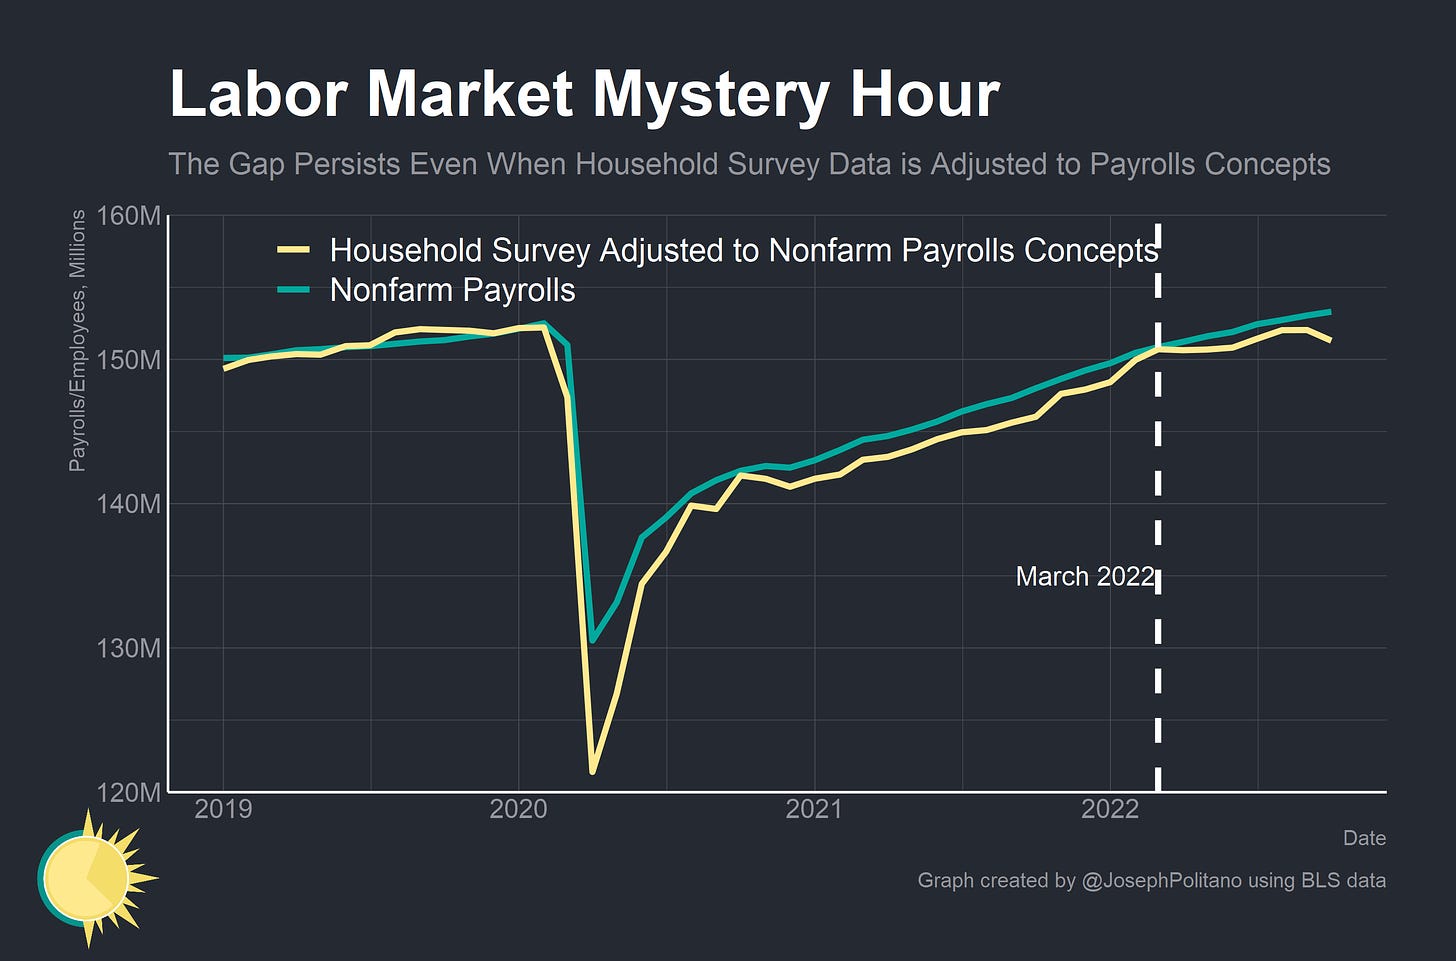
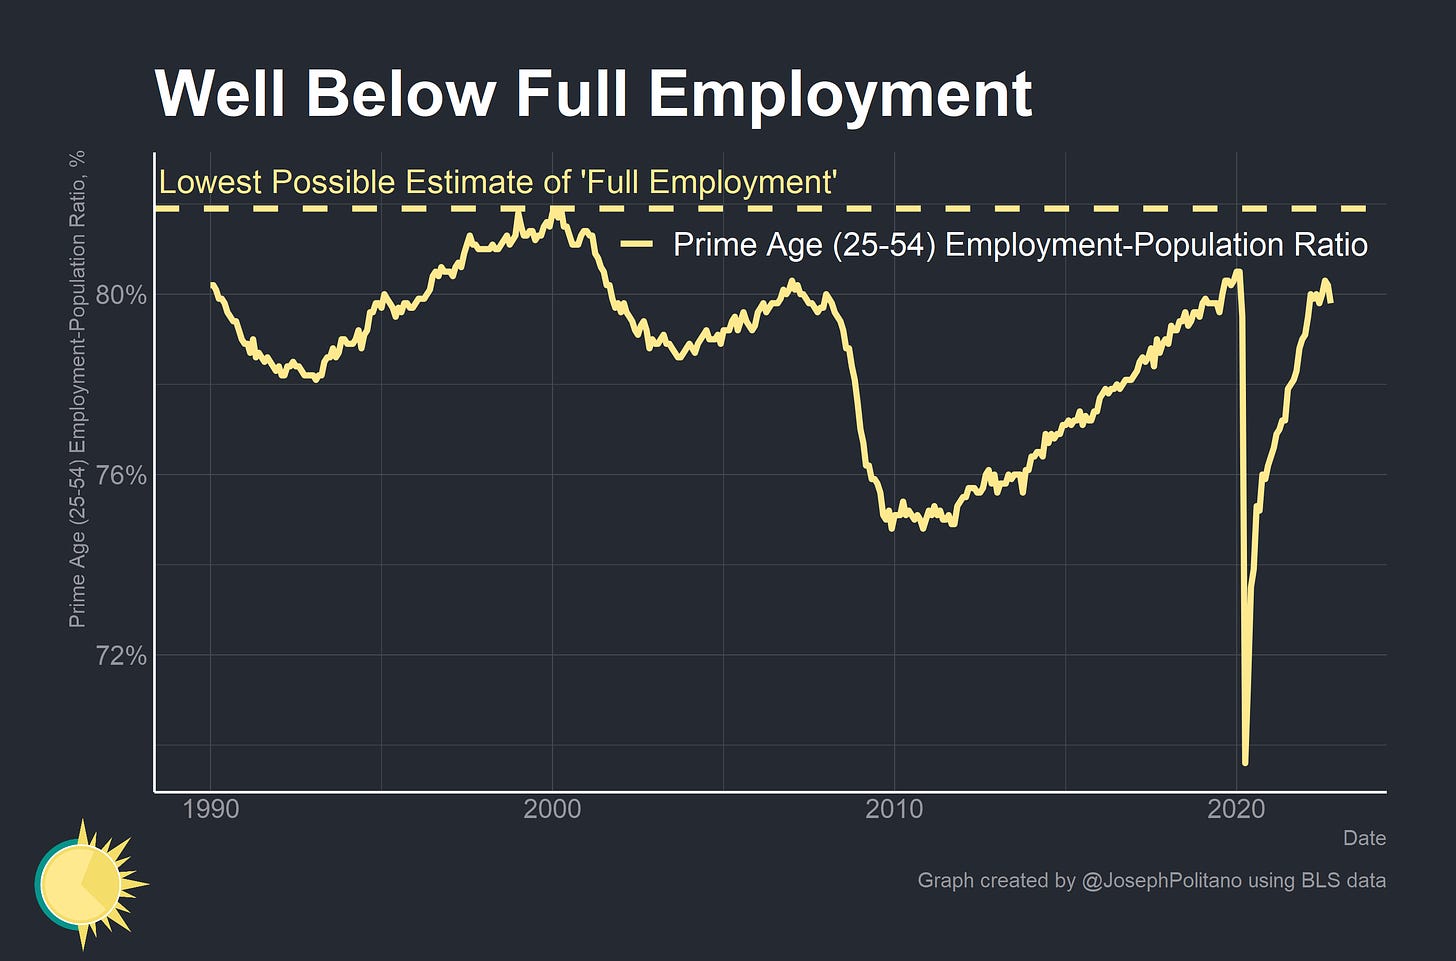
However, as I’ve written about before, the US labor market may not be quite as strong as it initially appears—although nonfarm payroll data has been growing at a steady clip employment levels and rates have stagnated since March of this year. The nonfarm payroll data—derived from surveys of business establishments—shows jobs increasing by 2.5 million since March of this year. Employment data—derived from surveys of households—shows the number of workers with jobs increasing by a comparatively meager 150,000 over the same timeframe. What explains the growing gap?
Of course, the data comes from two different sources (business establishments or households) and two different surveys. But there are also some critical conceptual differences between employment levels and nonfarm payrolls:
Multiple jobholders count once in employment levels but count twice in nonfarm payrolls
The unincorporated self-employed count in employment levels but do not count in nonfarm payrolls
Agricultural and related workers count in employment levels but do not count in nonfarm payrolls
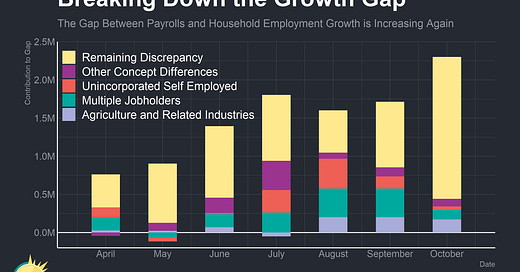
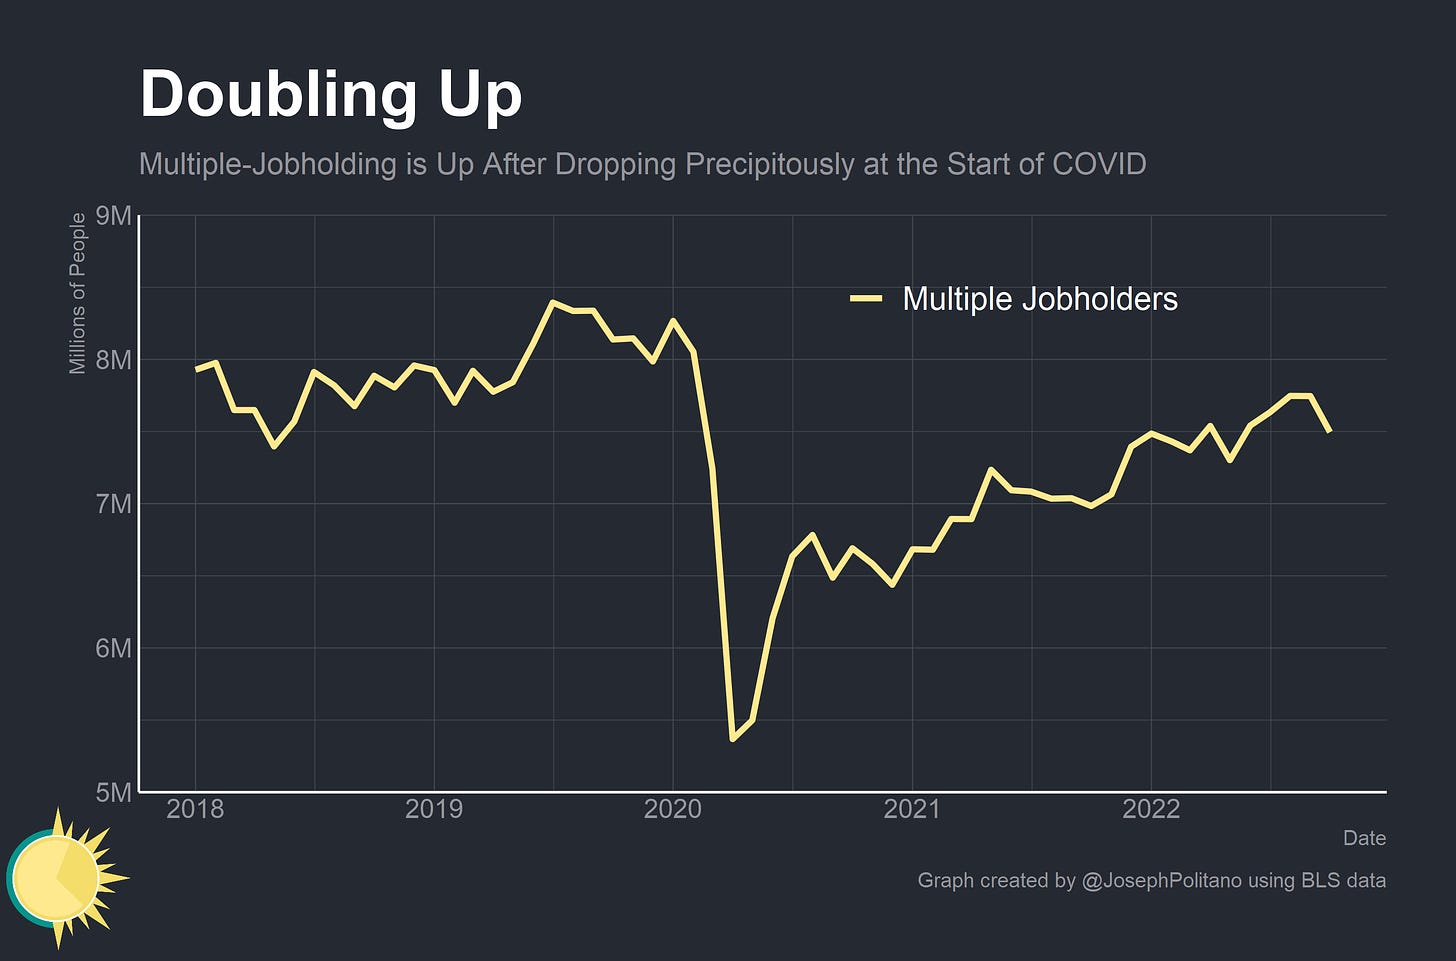
Multiple-jobholding is on the rise again after collapsing at the start of the pandemic, though its net growth since the start of this year remains relatively low. Right now, it does not look like a big contributor to the gap between employment and nonfarm payroll levels.
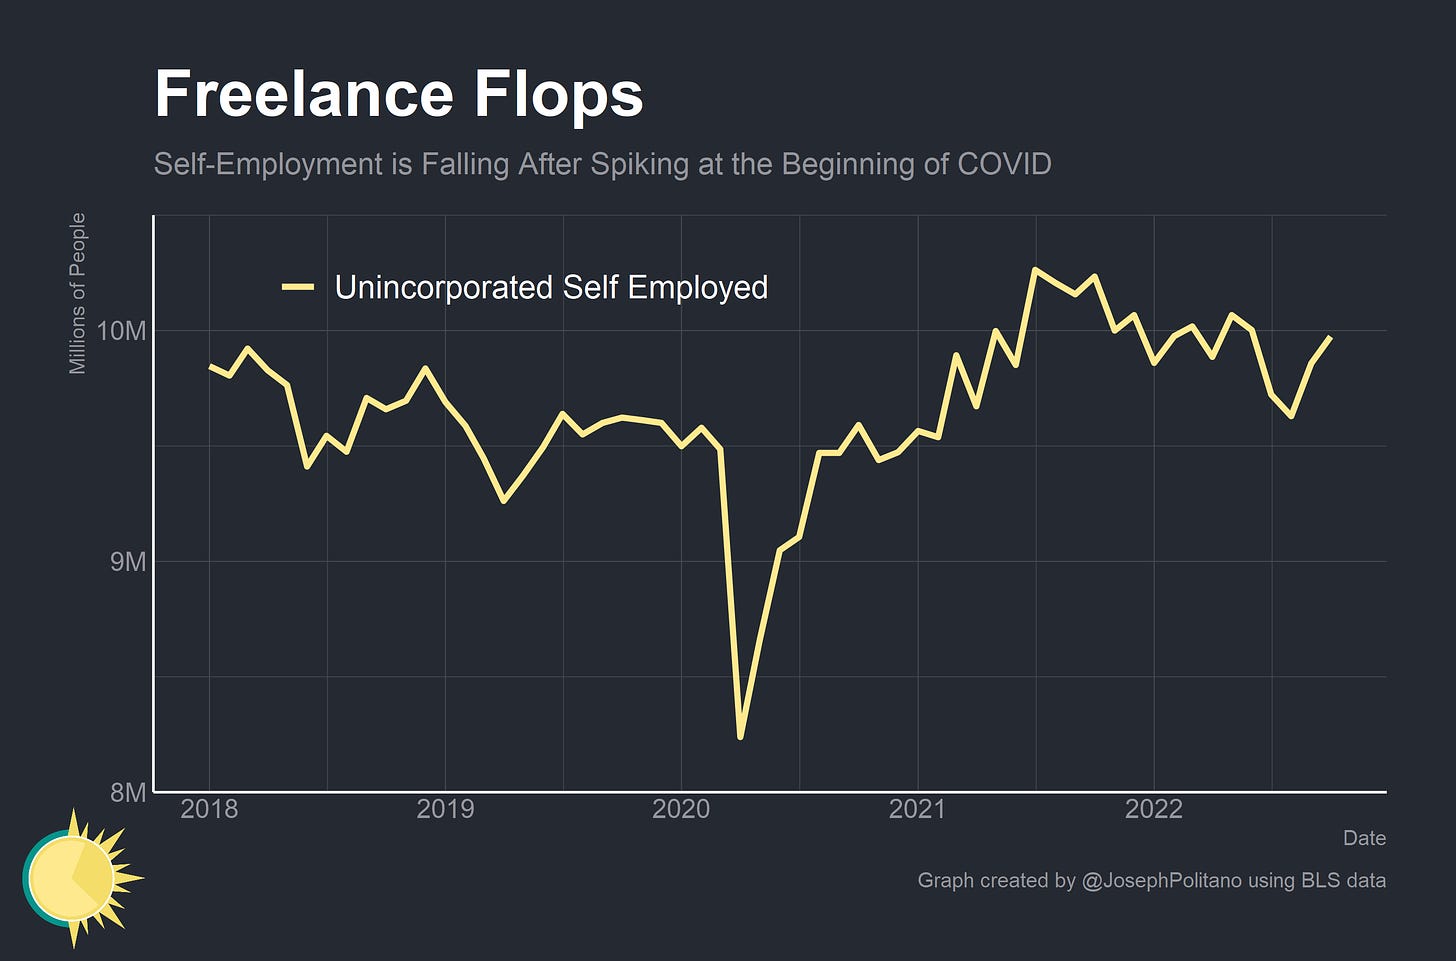
Self-employment tells a similar story, just inverted—the number of people working for themselves has been declining since its peak in mid-2021, but on net it has actually increased so far this year. Again, it is only a small contributor to the gap that has opened up since March.
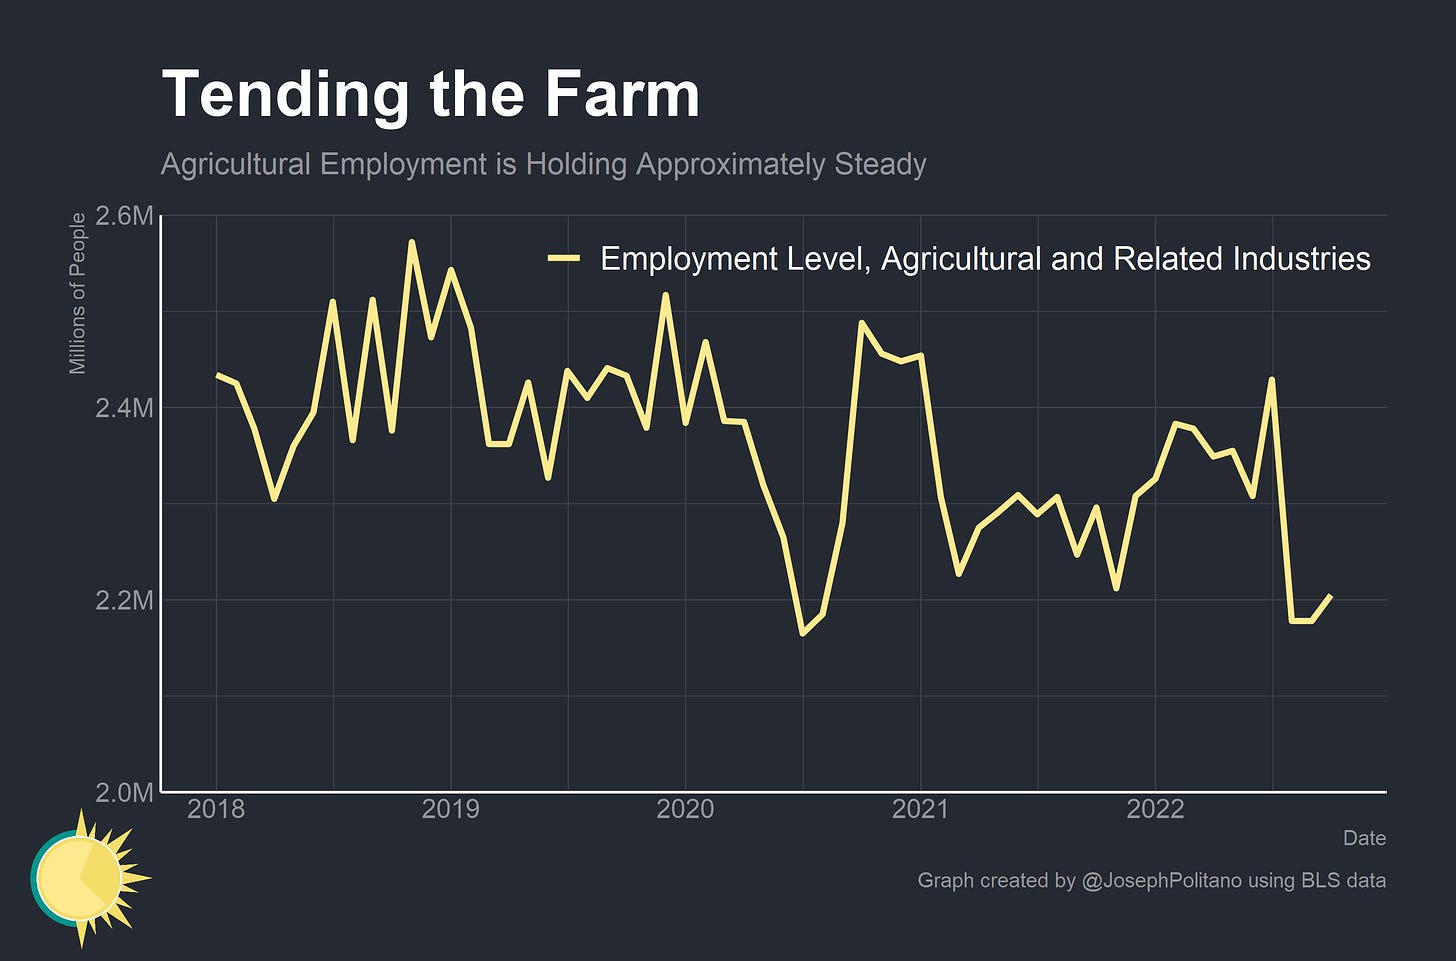
Agricultural employment, the last and most-volatile conceptual difference, has also decreased by about 180,000 since the start of this year. This actually makes it the most important conceptual difference in terms of explaining the gap between the two surveys, but even then its contribution is tiny compared to the more than 2 million-sized gap between the two surveys.
The “remaining discrepancy” of unexplained differences between the two surveys makes up the vast, vast majority of the difference in growth since March—especially after the most recent jobs data release for this October.
As of writing, the adjusted household survey sits two million workers below the nonfarm payroll data—and we know some upcoming revisions are actually likely to increase the gap. The BLS estimates that end-of-year revisions to the 2022 payroll data will actually increase payroll levels by more than 450,000. So what’s driving this massive discrepancy?
Three (Main) Thoughts
1. Population estimates could be wrong
The way employment numbers are essentially calculated is by applying employment rates from the household survey data to population estimates prepared at the beginning of each year. Hence, if population growth comes in higher than the beginning-of-year estimates employment data will be significantly below payroll data until the population data is updated at the start of the following year.
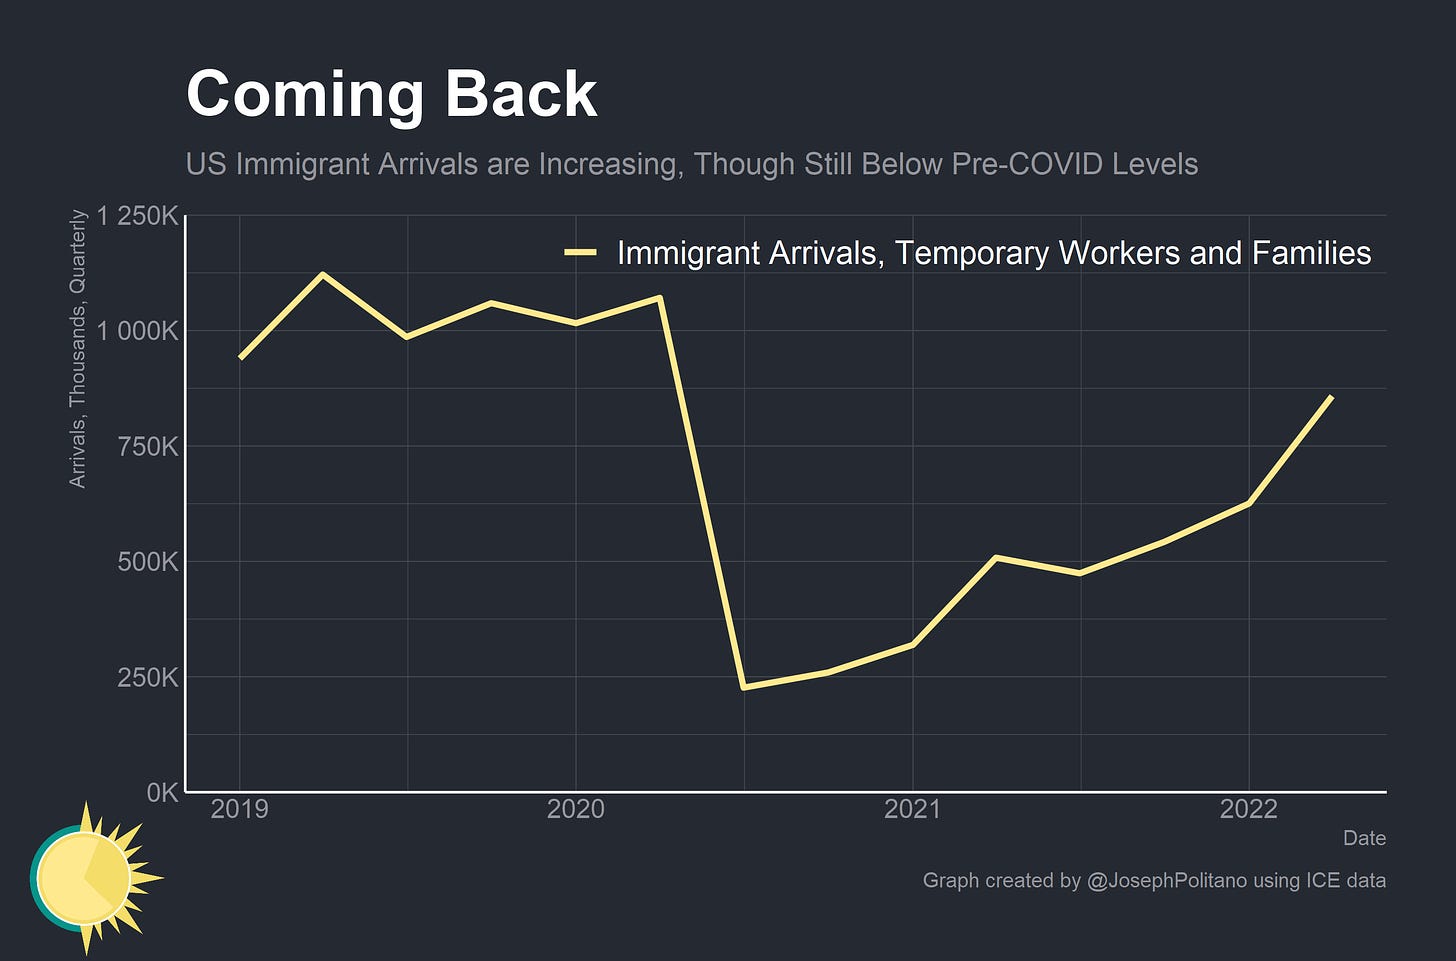
So what could drive a misestimation of population growth? Predicting US population growth during COVID has been hard for obvious pandemic-related reasons. Births, deaths, and immigration levels are all influenced by public health in ways that are extremely hard to model or forecast—at the start of this year population estimates were revised up by more than one million. The uptick in immigration levels we have seen in the first half of this year could show up in payroll data but not employment levels—as might lower-than-expected COVID deaths. Importantly, if this is true it would likely mean that the economy is worse than it looks—although population revisions would increase the raw number of workers employment rates would have still stagnated.
2. Employment data is catching a turning point before establishment data
Tracking data in real-time is much more difficult than making accurate assessments of the past—and that is especially true around economic turning points. Household survey data is much noisier than establishment survey data—but the same broad-population survey processes that generates this noise can also be incredibly useful in assessing economic turning points. Employment rates from the household survey caught economic weakness in 2000 and 2006 before nonfarm payrolls did—so it’s important to pay attention to it now.
3. Maybe it’s just a fluke
The unsatisfying answer is that we need more data to make an accurate assessment of the situation, and that will take some time. Population estimates were revised significantly last year but so were seasonal factors for nonfarm payrolls among other important factors. Response rates for all BLS surveys have been plummeting since the start of COVID—household survey response rates went from 82% at the end of 2019 to 72% today and establishment survey unit response rates went from 60% to 45%. That can make data less reliable and more volatile—and could contribute to discrepancies like this.
Second-quarter estimates from the extremely comprehensive Quarterly Census of Employment and Wages will come out later next week and the Business Employment Dynamics release will come out early next year, both of which will shed some much-needed light on the situation.
Conclusions
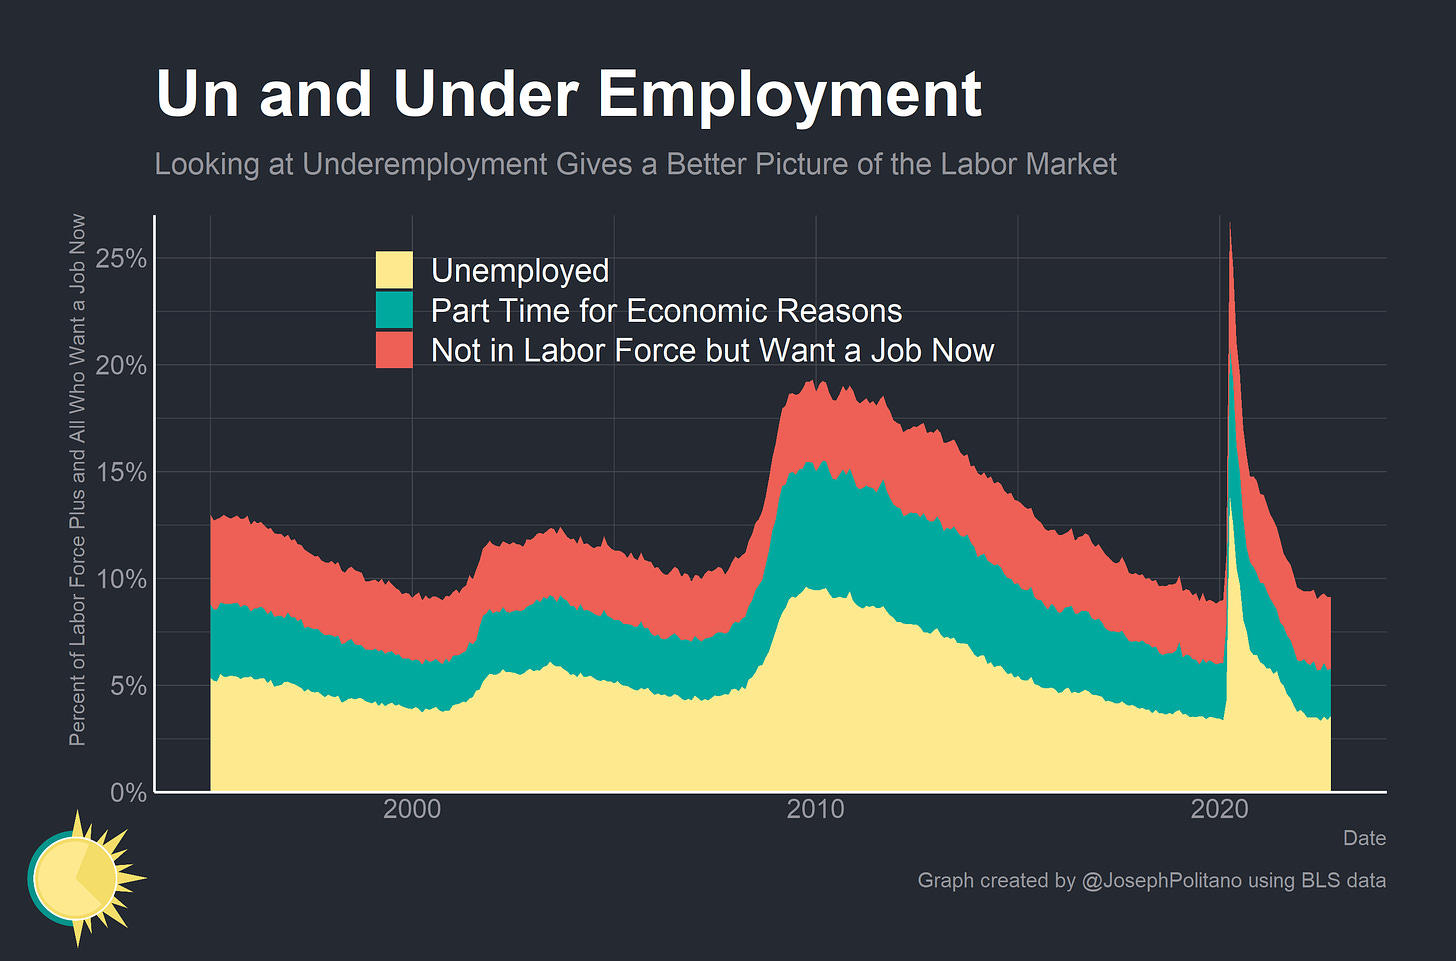
Data discrepancies like this put in harsh relief how difficult it is to assess the state of the economy in real-time, and how important it is to look at data in a broad and robust fashion. As another example, take unemployment—even though the unemployment rate is near a historic low the number of people outside the labor force who “want a job now” is nearly one million above pre-pandemic levels. Looking at unemployment alone gives you an incomplete picture of the labor market—just as looking at the nonfarm payrolls data or employment data alone gives you an incomplete picture of the economy. The difficult answer is that we will have to wait for more information to get clarity on this labor market mystery—but in the meantime, it will be critical to keep track of developments in both employment and payroll data.

