The Most Important New Inflation Indicator
Introducing the New Tenant Repeat Rent Index—A New Way of Measuring Housing Inflation
Thanks for reading! If you haven’t subscribed, please click the button below:
By subscribing you’ll join over 20,000 people who read Apricitas weekly!
Otherwise, liking or sharing is the best way to support my work. Thank you!
Housing is the most important single expense for Americans, making up about 1/3 of the total Consumer Price Index (CPI) alone—so measuring housing costs is a highly critical part of measuring inflation.
That’s why the Bureau of Labor Statistics (BLS) is extremely comprehensive and thorough in how it measures rent prices—the BLS essentially takes a massive, nationwide, rolling sample of housing units, splits them into panels, and then surveys each panel once every six months. Data on rents are collected and adjusted for things like building age, renovations, amenities, complimentary utilities, and so on to construct an index of rent prices. Local samples of rental units are then used to construct a comparable price index for homeowners (called owner’s equivalent rent or OER), and now BLS can calculate accurate housing price changes across the United States.
There is one problem with this data, however—it lags economic conditions significantly. The BLS is trying to measure contract rents (the amount renters are currently paying, regardless of when they signed a lease) not spot rents (the amount renters would pay to sign a new lease today). Given that leases are only usually re-signed once a year, and the BLS only surveys units once every six months, shifts in the rental market tend to only show up in CPI data with a significant lag.
To be clear, the BLS’s methodology is the most robust way of measuring prices in the rental market, as measures of spot rents can be more volatile and biased thanks to shifts in rental turnover dynamics. But the lags in CPI present a real problem for the Federal Reserve: properly setting monetary policy is even more difficult when the most important and most-cyclical part of inflation data comes out with a significant lag. So how can the Fed know precisely what’s going on in the rental market—and how it will affect future inflation? That’s where researchers at the BLS and the Cleveland Fed come in with what could be the single most important new inflation indicator—and I don’t say that lightly.
Introducing the New Tenant Repeat Rent Index
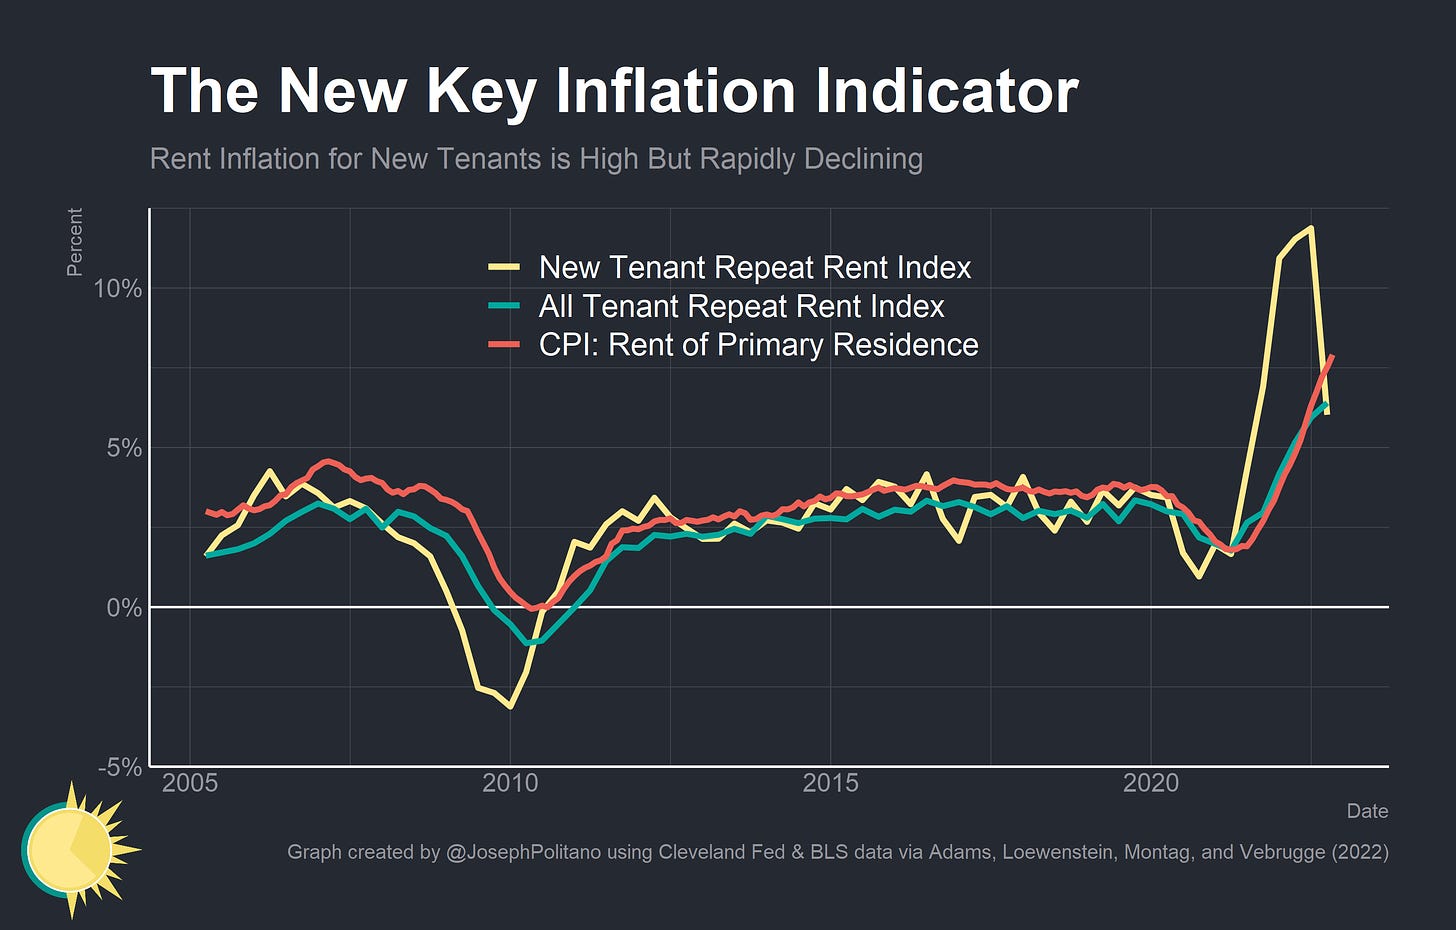
Brian Adams, Lara Loewenstein, Hugh Montag, and Randal J. Verbrugge published published “Disentangling Rent Index Differences: Data, Methods, and Scope” where they created the New Tenant Repeat Rent (NTRR) Index and All Tenant Repeat Rent (ATRR) Index. Using the same underlying BLS microdata that composes the housing component of the CPI, the NTRR uses information on lease turnover to track rent growth in units that change tenants. The ATRR covers all housing units but attributes rent changes to when they happened, as opposed to the official CPI data which tracks price changes when units are surveyed.
The paper helps identify the relationship between NTRR, ATRR, and the official CPI—in particular, it says the ATTR leads the official CPI data by about one quarter and the NTRR leads the official CPI by about a year. This is a critical signal for monetary policy, as the NTRR caught the weakness in housing price inflation in 2006/2007 long before official CPI data. Given the NTRR readings in 2022, we can currently expect year-on-year rent inflation to peak in Q1/Q2 of this year and begin decreasing in Q2/Q3.
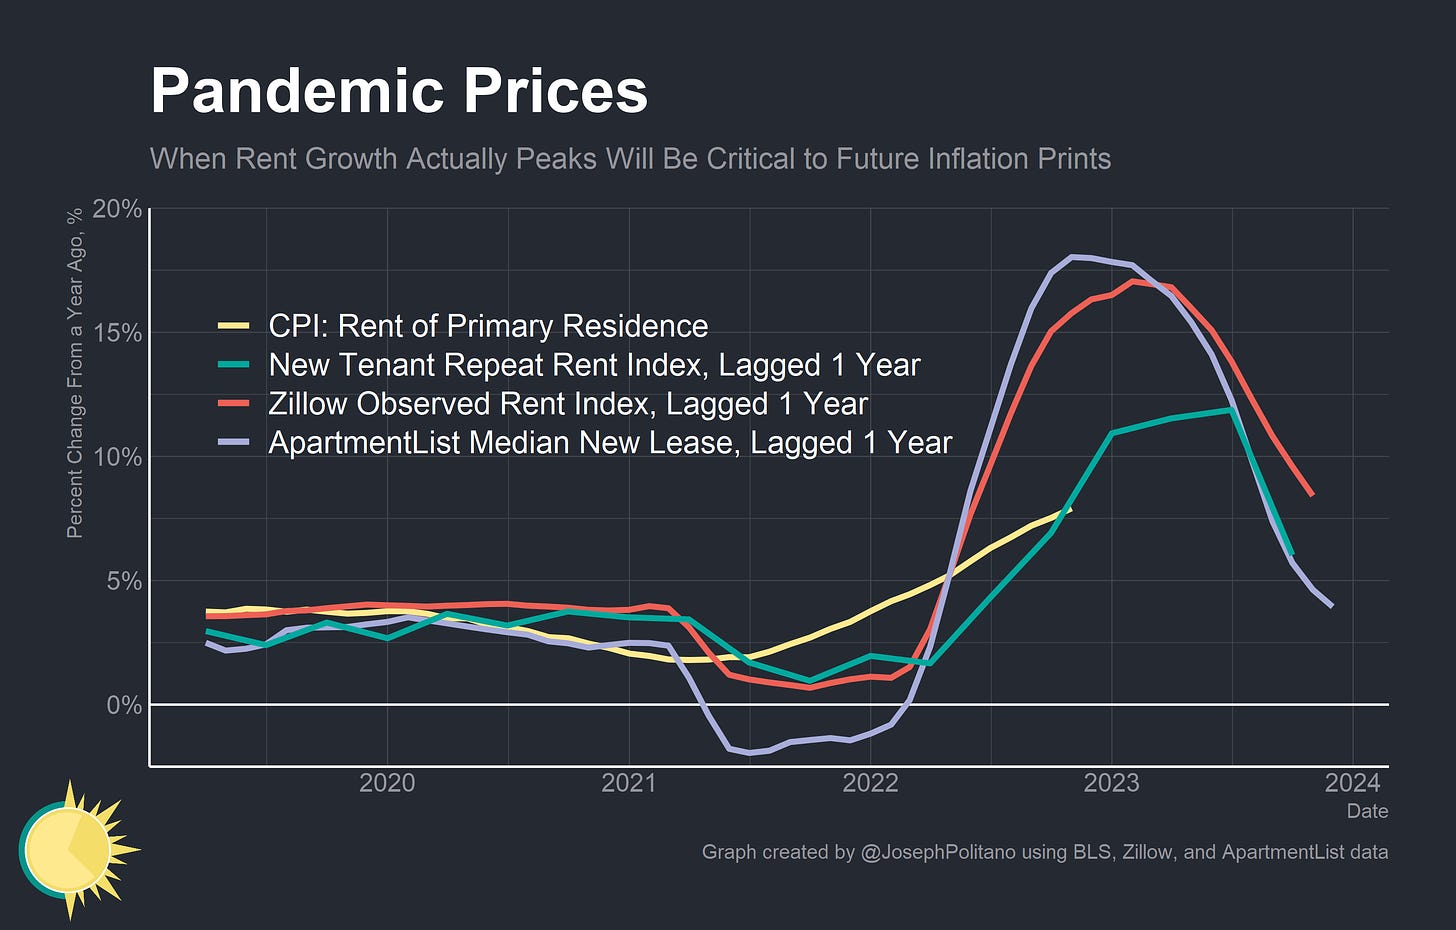
Also, this data helps confirm some of the signals that private-sector rental data have been showing since June of this year. Similar repeat-rental datasets from ApartmentList and Zillow have been showing rapid decelerations in year-on-year rent growth since this summer, and the NTRR data affirms this while suggesting a later and lower peak for housing inflation.
Compared to private sector data, the NTRR has two big advantages—firstly, it is built directly from survey data on contract rents, whereas Zillow and ApartmentList’s observations are based on data from online rental listings. The CPI housing survey is going up to panels of representative samples of the rental stock and recording contract rents directly, from which the NTRR pulls out units with both new tenants and previous new-tenant rent estimates to compare against. Zillow and ApartmentList data construct repeat-rent indexes by tracking the prices for rentals on their platforms, treating a unit as rented for the last-listed price once it leaves the platform, and then comparing against previous rental prices for the same unit. Critically, that could have led them to miss offline bidding wars or rent concessions—but NTRR data confirms they are largely on the right track.
Secondly, NTRR data is likely less susceptible to sampling bias than private-sector data. The rentals listed on sites like Zillow and ApartmentList are a nonrepresentative subset of the entire rental housing stock—they tend to be professionally-managed higher-end units in richer neighborhoods. If you look at Washington, DC, for example, the rental housing stock is disproportionately located in the majority-Black lower-income areas of the Southeast while online private listings come disproportionately from the majority-White higher-income areas of the Northwest. Both Zillow and ApartmentList adjust for this by weighing their data to representative samples from more comprehensive sources, but you could imagine biases that persist and are hard to adjust for (for example, what if the pandemic caused a structural shift in who was using private listing sites, where they were moving to, and what types of housing units they wanted?).
Besides, neither private dataset is explicitly trying to forecast the CPI—they are trying to provide an accurate picture of the current nationwide rental market, which is a different task. Hypothetically, having a dataset biased towards large, professional landlords could actually provide a better understanding of rental market dynamics if professional landlords adjusted prices faster based on market conditions—but that wouldn’t make it a better forecaster for CPI, which has to correctly sample rentals owned by smaller landlords. The NTRR is ideal for CPI forecasts since it is literally built from CPI microdata weighed similarly to the official CPI rent indexes.
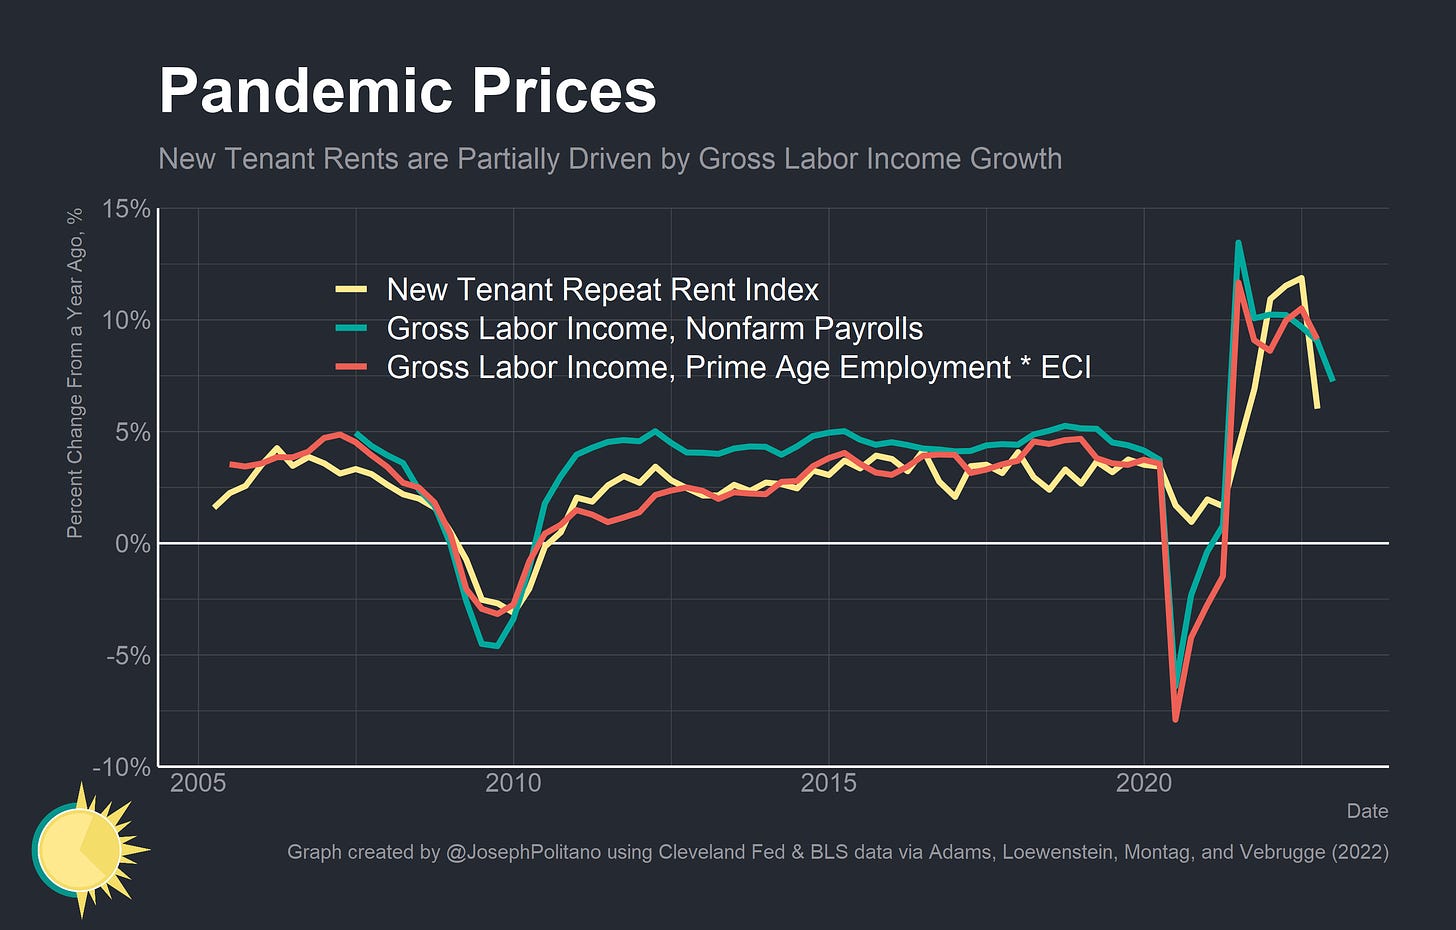
NTRR data also helps affirm the relationship between monetary policy, labor market dynamics, and the cyclical components of inflation. Growth in Gross Labor Income (GLI), the sum of all wages and salaries in the economy, is highly correlated to cyclical growth in the rental components of CPI, but previously we could only see this relationship with a time lag and a gap in growth rates. With the NTRR, we can see the relationship much more clearly—cyclical economic strength influences GLI growth, which then drives movements in rents for new tenants, which then gets passed on to CPI housing indices with a one-year lag.
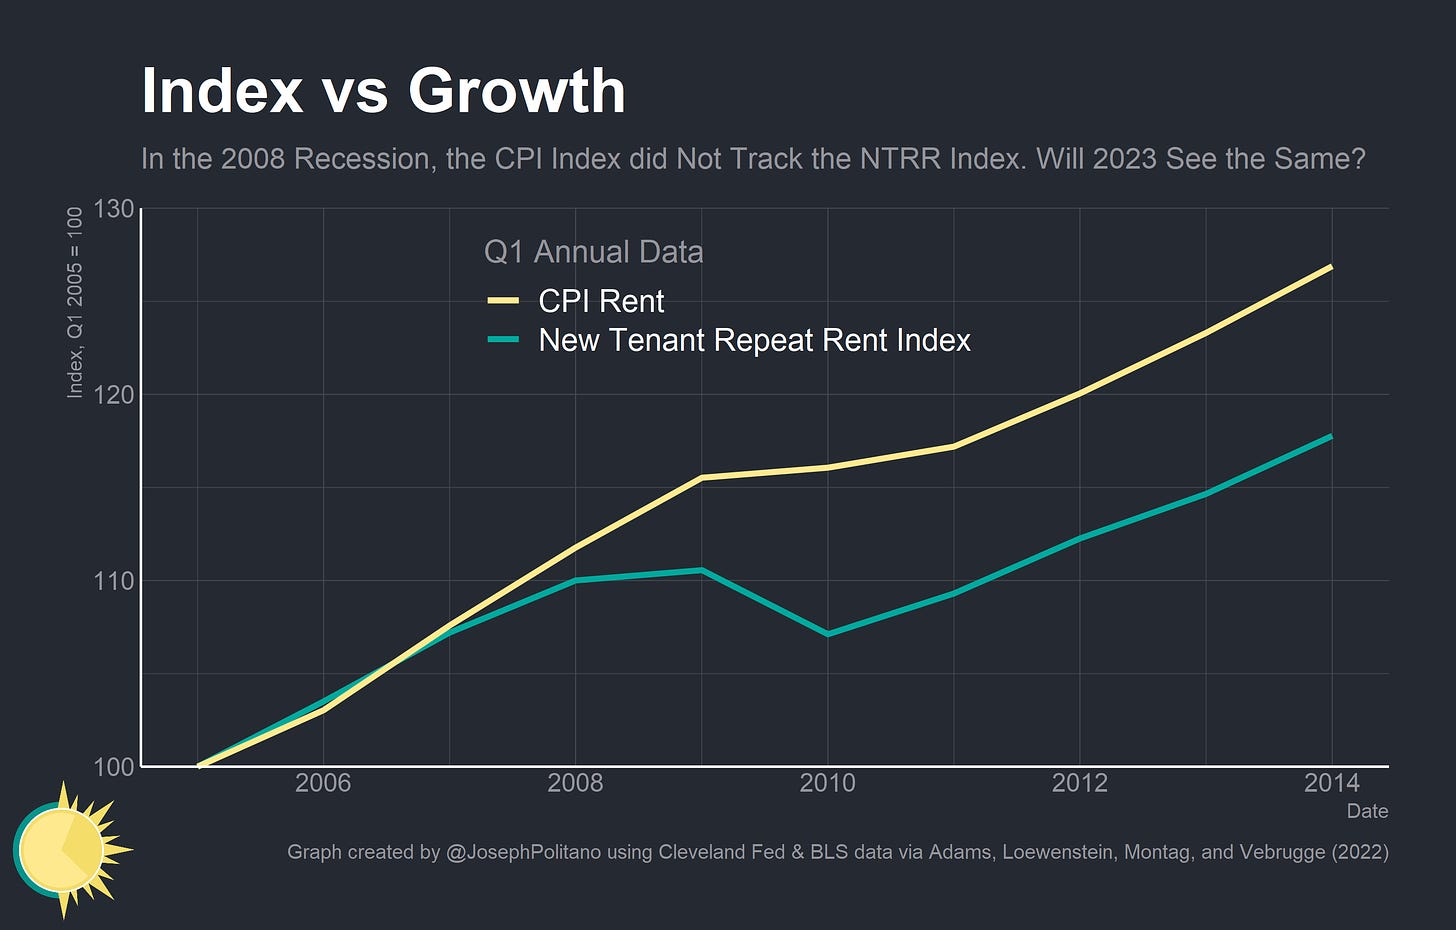
However, there are two big question marks remaining regarding the NTRR data. The first is to what degree housing inflation will follow the level of new tenant rent growth—that is, will the price of all rentals eventually catch up with the significant growth we saw in new rentals, or have the new rentals seen disproportionately high price growth that will not be mimicked by the rest of the market? In normal times the level of NTRR growth tracks the level of CPI rent growth fairly well, but rapid changes in vacancy dynamics can lead the subsample of new leases to become less representative of the total housing market. In 2008 the CPI rent data did not track the level of NTRR increases because the spike in vacant housing units around the recession led to faster falls among the subset of new leases—but it’s hard to know if CPI data will likewise not follow the level of today’s NTRR because of the rapid fall in vacancies during the pandemic. Fundamentally, only one prior business cycle has been captured by NTRR data, and it was a deflationary housing bust, not an inflationary housing boom.
The other issue considers some unfortunate, unavoidable limitations of the underlying microdata that goes into the NTRR. In order to calculate the NTRR, at least two separate new-tenant move-ins must be observed for a sample housing unit. However, since units are now rotated out every six years and units with renovations are excluded from the NTRR, only a small proportion of the total housing survey data meets this requirement. Since 2015, Out of the entire about 10,000 units sampled each quarter, only between 500-1500 will be incorporated into the NTRR—and more than 80% of the data incorporated into the NTRR now come from apartments. The number of data points in the NTRR has been trending downward for several years as well.
Secondly, because the BLS housing survey only samples units only every six months, NTRR data for the most recent two quarters has an even smaller sample. Microdata collected in Q4 could show new tenants with rent changes at any point in the last six months (so possibly in Q2 or Q3), but that information cannot be incorporated into Q2/Q3 NTRR data until Q4 surveys are completed. That leads the NTRR’s most recent estimates to have wide confidence intervals that will improve with time as new data is incorporated and the estimates are revised—making the NTRR less useful in forecasting inflation one year away than in forecasting inflation six months away.
Conclusions
“In determining the pace of future increases in the [federal funds rate] target range, the Committee will take into account the cumulative tightening of monetary policy, the lags with which monetary policy affects economic activity and inflation, and economic and financial developments.”
Federal Open Market Committee Statement, December Meeting
Jerome Powell and Federal Reserve officials are well aware of the lags present throughout inflation data, especially as it related to housing—and they are looking to set policy accordingly. The idea that new tenant rents lead CPI data is not news to them—but having high-quality up-to-date quantitative information on the movements in new lease prices and their influence on CPI will significantly help to shed light on the inflation outlook for next year.
Still, it’s important to remember that although rents are the single largest item in the CPI, they still do not compose the majority of the basket—or the majority of today’s inflation—Prices for services excluding housing have risen by 7.2% over the last year, just shy of the 7.9% growth in rent, and housing is also a much smaller component of the Fed’s preferred Personal Consumption Expenditures price index. Fundamentally, growth in nominal gross domestic product, nominal gross labor income, and nominal personal spending are decreasing but are not yet at a level consistent with the Fed’s 2% inflation target—making inflation more broad-based than just housing pressures. Still, NTRR provides some much-needed clarity for one of the most important—and most complicated—components of inflation.


Good explanation. I recently read an article that noted that more people are renting single family homes now (presumably because of the still-rather-high price of buying). How might that affect this new measure?
A January 2023 New York Fed study of “inflation persistence” found “the housing sector clearly stands apart.” After wisely cautioning that a “backward-looking. . . twelve-month measure gives too much weight to data a year old,” the authors find a common inflation trend for both goods and non-housing services (contrary to Chair Powell) with both declining. “The common trend has declined since early 2022,” they demonstrate graphically, but the “sector-specific trend. . . almost entirely driven by housing has continued to increase.”
The data lag of OER -with its 24.5% weight- is a huge distortion which the Harmonized Index of Consumer Prices easily fixes (or CPI less shelter, or PPI).