The Regional Impacts of America's Investment Boom
A Detailed Look at How Investments in Clean Energy, Semiconductors, & Infrastructure are Reshaping American Economic Geography
Thanks for reading! If you haven’t subscribed, please click the button below:
By subscribing you’ll join over 44,000 people who read Apricitas!
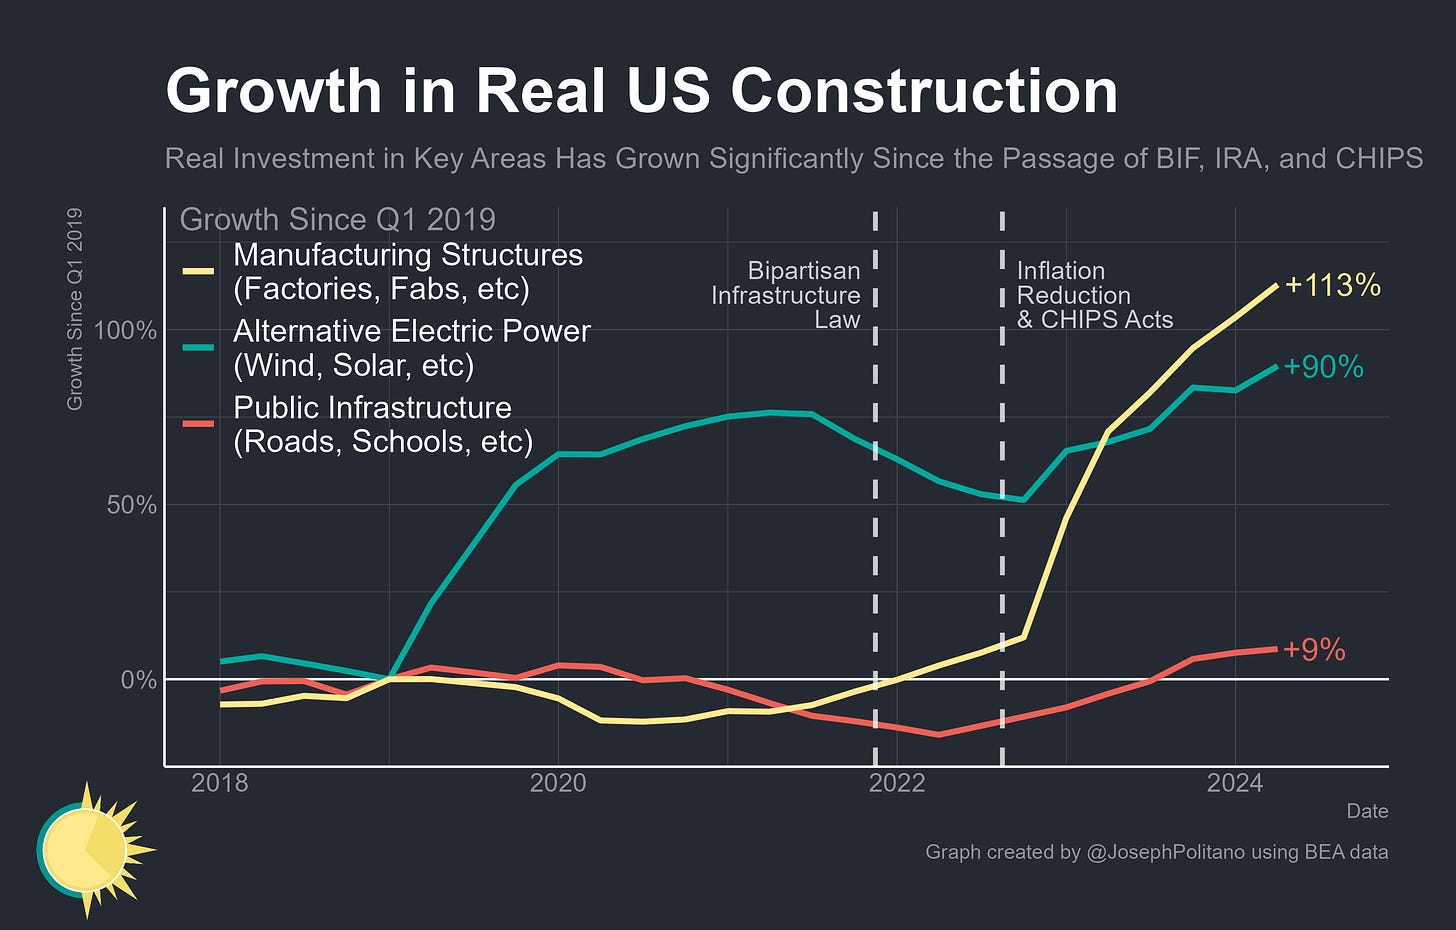
Throughout the Biden Administration, America has passed a flurry of bills designed to increase domestic investment as part of the country’s new economic and industrial strategies. That process began with 2021’s Bipartisan Infrastructure Law (BIF) and continued in 2022 with the passing of the Inflation Reduction Act (IRA) and CHIPS Act, with those three bills heavily subsidizing US investment in physical infrastructure, clean energy, and semiconductor manufacturing, respectively. That spending is now bearing fruits today—since 2019, real US manufacturing construction has increased by 113%, real clean energy deployment has increased by 90%, and real public infrastructure spending has increased by 9%.
Those investments are occurring throughout the entire country, in forms like cutting-edge semiconductor fabricators in Arizona, new stations on the Chicago L, Nevada’s largest solar power plant, an expanded terminal at Orlando International Airport, and much, much more. The benefits are likewise being felt across the US—the White House boasts that 99% of America’s high-poverty counties have seen some kind of construction enabled by recent legislation.
Yet at the same time, the growth in public investment has intentionally not been spread evenly across the US, instead having important local and regional dynamics baked into the programs’ founding texts. BIF, IRA, & the CHIPS Act all contained a grab-bag of provisions that pushed spending toward specific areas—that includes prioritizing fossil-fuel towns for investments in clean energy supply chains, concentrating infrastructure investment in low-income areas, kickstarting new regional industry clusters, creating special programs for rural revitalization, and much more. The end goal of America’s investment push was not simply to rebuild US industry but to also use investment spending as a way to fundamentally change how growth is spread across the country.
So far, the result has been that the select few states home to major semiconductor investments—including Arizona, Ohio, Texas, and more—are all experiencing massive construction booms, historically unprecedented in both their size and speed. At a broader regional level, spending has primarily served to defend the economies of the long-struggling Rust Belt while accelerating growth in the long-booming Sun Belt. And at the most local levels, the growth in public investment has benefitted America’s rural, conservative areas more than its urban, liberal ones—an intentional effort crafted by lawmakers to combat the regional inequalities of the 2010s and buy political staying power for the projects’ end goals.
Today, most of these investment projects are still being built, and thus the greatest impacts on local economies come in the form of construction spending and associated jobs. Yet there are already material benefits emerging as the first wave of projects come online, including a 30% increase in solar power generation over the last year and rapid hiring at new electric vehicle factories throughout the country. The local economic impacts of these new projects will thus grow further in the near future, and if the investment boom is successful they could help reshape America’s economic geography.
The Manufacturing Construction Boom
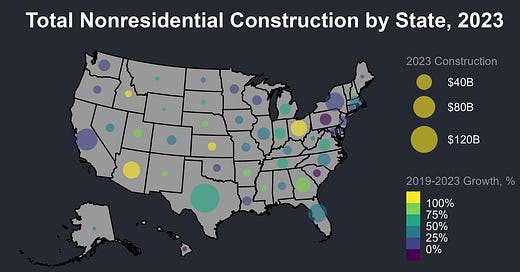
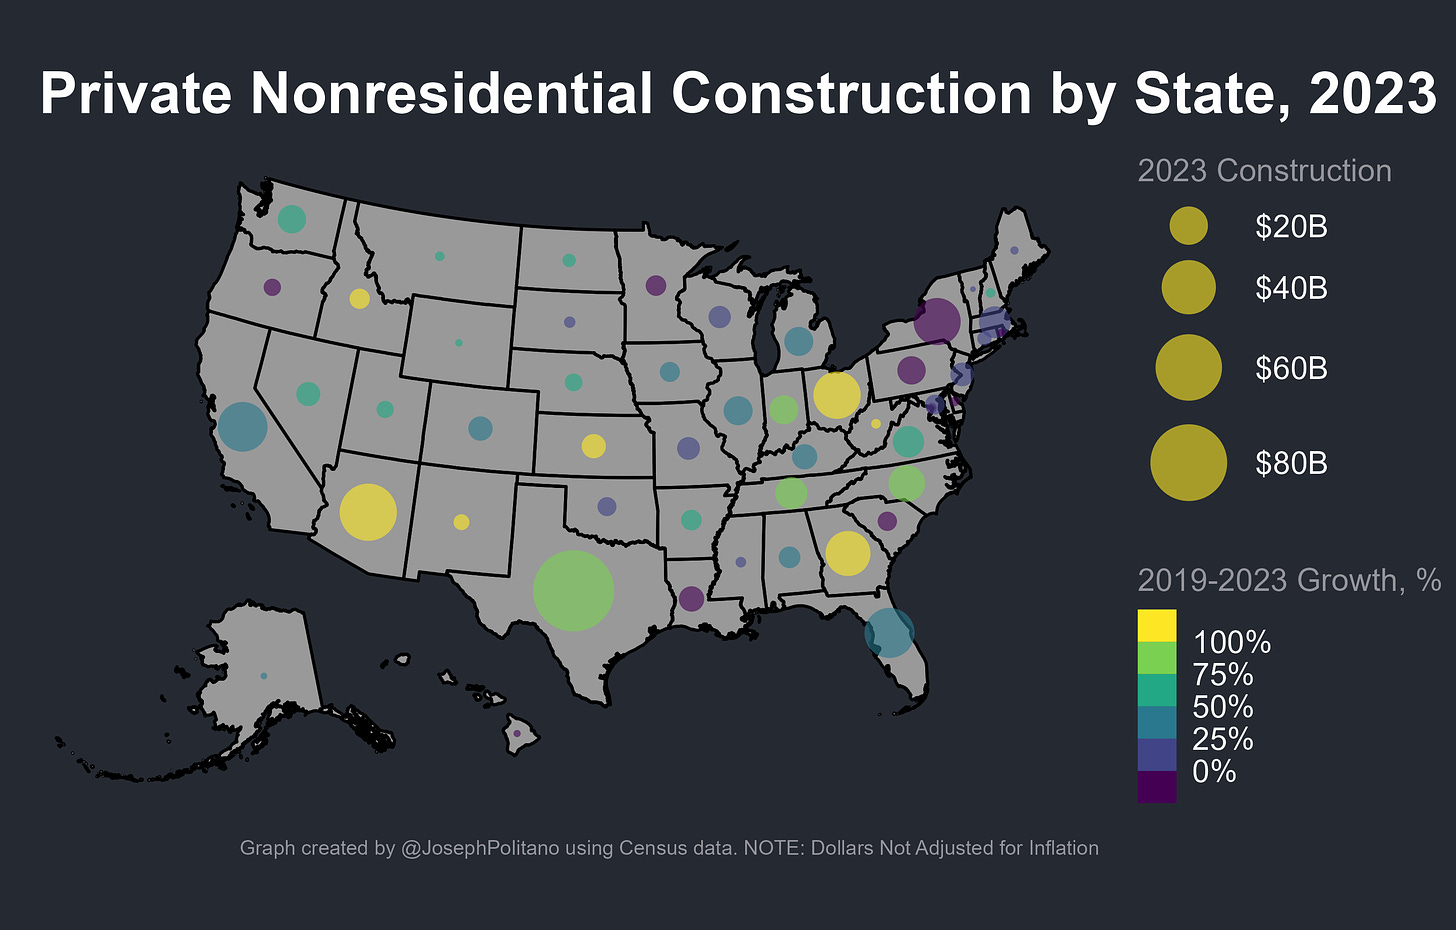
The most important prong of America’s investment push comes from the surge in factory and fabricator construction as a result of the CHIPS Act semiconductor projects & IRA cleantech manufacturing projects. Total nominal US private nonresidential construction increased by more than $200B from 2019 to 2023, with most of those gains coming from a $113B, 140% increase in spending on US manufacturing construction. Most states have thus seen some significant increase in investment spending over the last four years—with the major exceptions of New York & Pennsylvania. However, those investments have been heavily concentrated in a select few states building the nation’s largest manufacturing facilities.
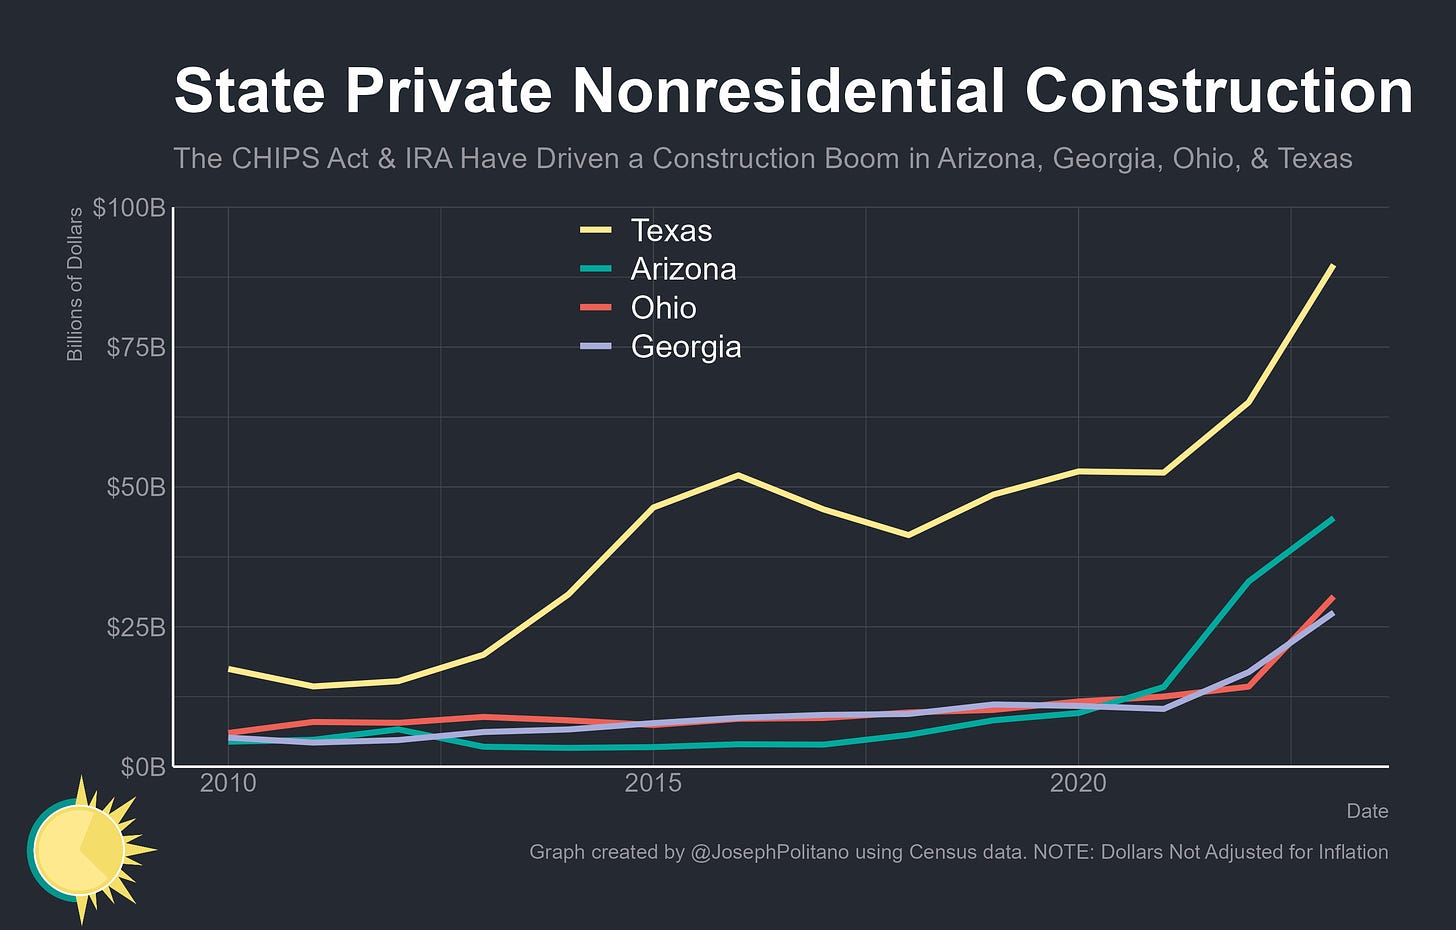
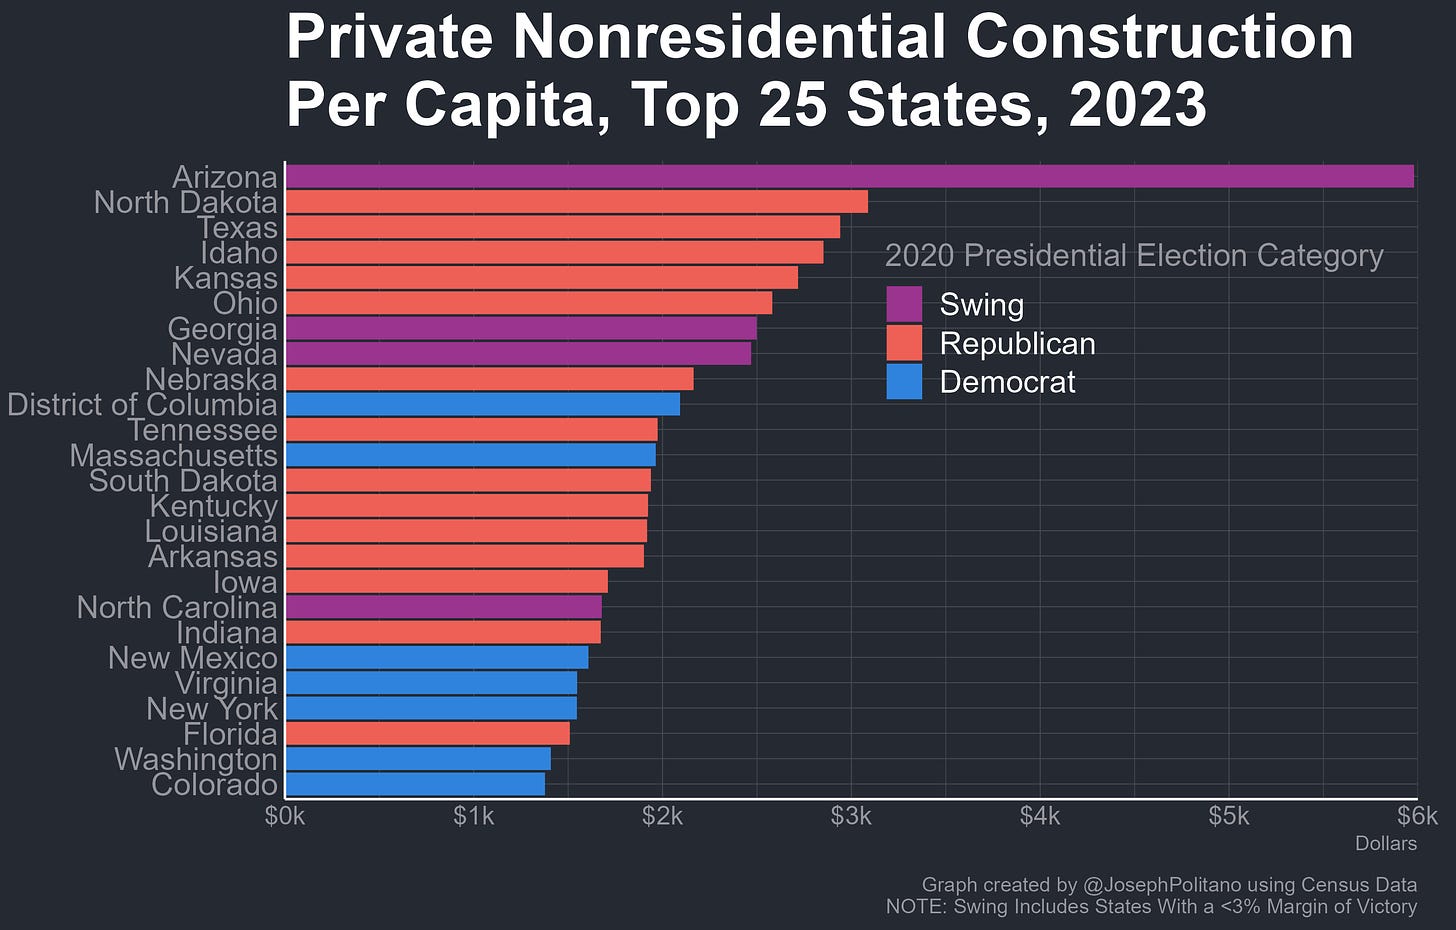
Four states in particular have seen the largest increase in nonresidential construction since 2019—Arizona (+$36B, +430%), Texas (+$41B, +84%), Ohio (+$20B, +200%) and Georgia (+$16B, +148%). That’s primarily a result of CHIPS Act-supported megaprojects—Texas, Arizona, and Ohio are all seeing massive semiconductor investments, with TSMC building the biggest fabs in US history in Arizona, Samsung constructing large facilities in the Lone Star State, and Intel working on a massive $20B facility in Ohio. Georgia is notable for having the strongest construction boom among states without a large chip fab, with investment instead coming through a diversified assortment of large EV, battery, and solar manufacturing projects.
When you break the nonresidential construction boom down on a per-capita basis, states or those that were close races or solidly Republican in the 2020 Presidential election take almost all of the top spots. Swing state Arizona scores far above the rest, with nearly double the relative spending of the next-highest state, and it takes until the twelfth spot to reach a state that Joe Biden won commandingly in 2020. This concentration of investment outside reliably-Democratic leaning states was an intentional downstream effect of many of the CHIPS Act & IRA’s provisions, with the end goal being to build long-term support for the laws by giving direct local benefits to electorates more hostile to decarbonization policies and public investment. In practice, this has meant directing investment towards the Sun and Rust Belt swing states key to this national election and areas controlled by Republicans in congress.
Using the more frequent monthly data available at the regional level, it’s clear the economic geography of manufacturing investment remains unchanged so far this year. Construction spending in the Western Gulf, Rocky Mountain, and Southeastern Seaboard regions all set new records, and spending in the Great Lakes region was down only slightly from the record high set in late 2023. New York should see a large increase in construction activity when a delayed Micron plant breaks ground next year, as should Oregon when large Intel expansion plans take effect, but besides that, the general trend of concentrated manufacturing investment in the Sun & Rust belts will continue.
America’s Clean Energy Investment Boom
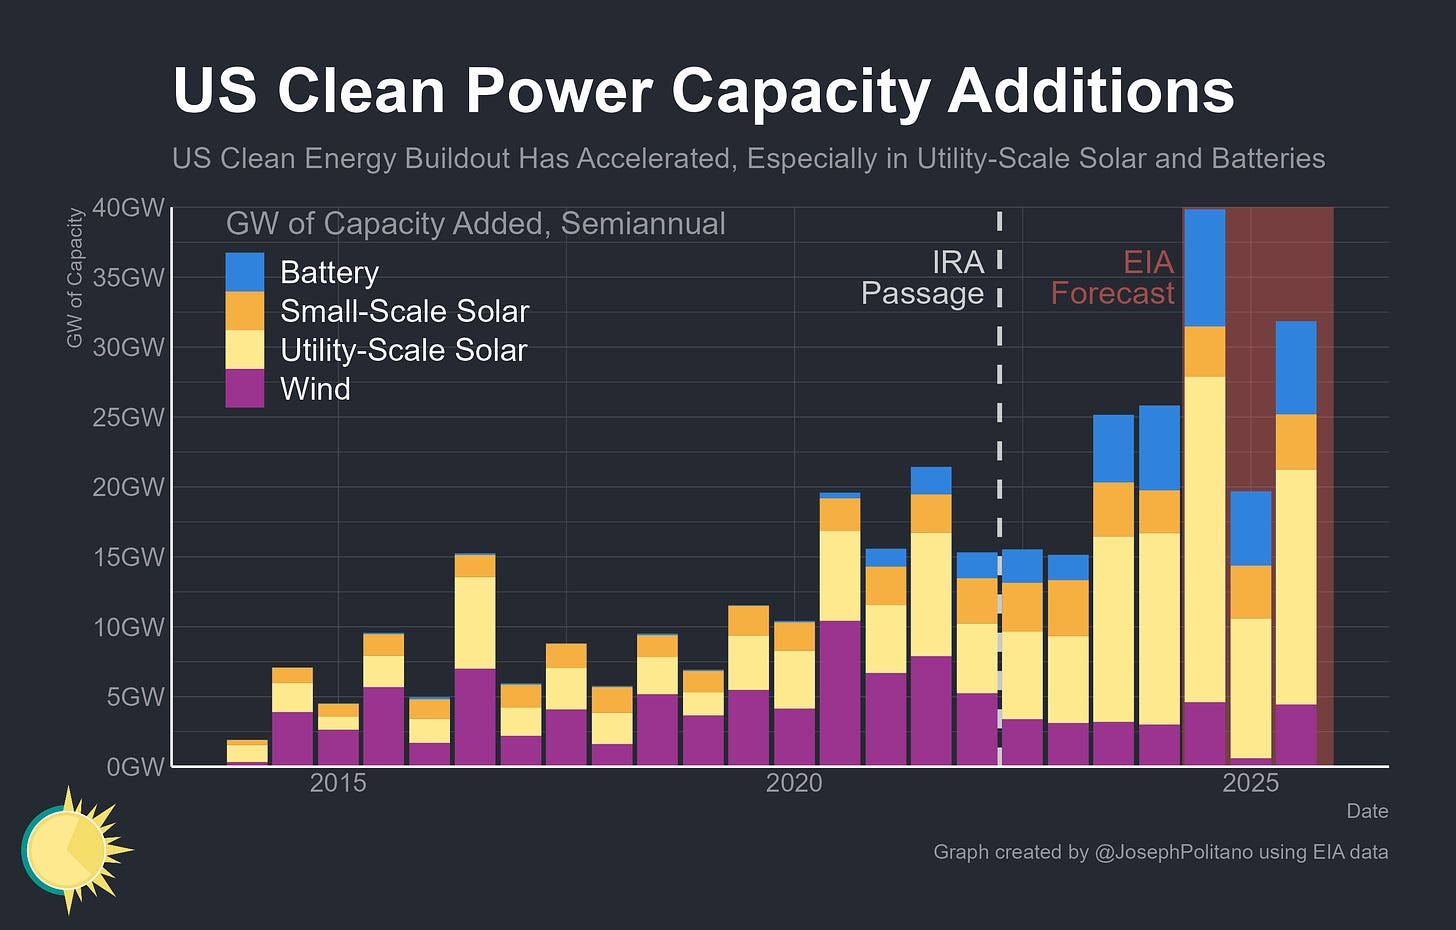
In addition to the boom in manufacturing construction, the US has seen a massive boom in renewable energy deployment enabled by the Inflation Reduction Act. The last six months have seen the fastest pace of clean energy additions in US history, with that record expected to be resoundingly broken over the next six months. In particular, there’s been a massive increase in the construction of solar power plants, which have rapidly become America’s largest source of new electric power capacity—spending on the construction of new solar facilities grew from $8B in 2019 to $18B in 2021 and $29B in 2023, helping to offset a decline in wind power construction amidst higher interest rates, rapid construction inflation, and slower wind speeds. There’s also been a massive boom in the construction of large-scale battery storage facilities, which complement the intermittent nature of wind & solar power generation.
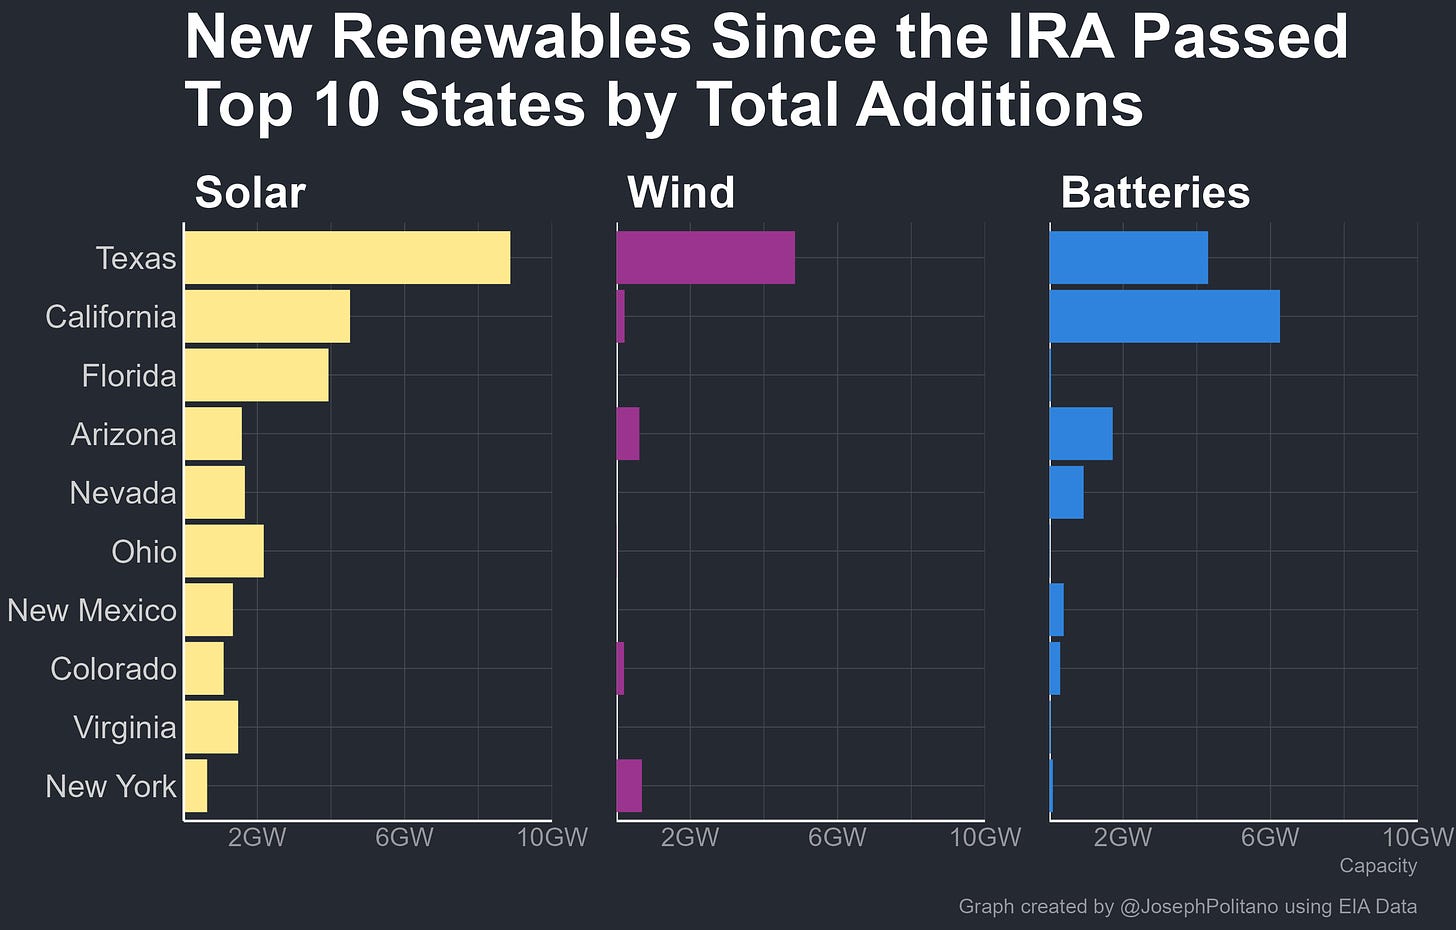
Yet just as with new manufacturing facilities, new clean energy resources have not been spread evenly throughout the US. Texas has been far and away the largest builder of new renewables since the passage of the IRA, with the state making up 37% of new US wind capacity, 29% of new US battery capacity, and 23% of new US solar capacity over the last two years. That’s in part due to the state’s natural geographic advantages, as Texas has among the best wind and solar potential of any state in the country and has a plethora of private land available for development. State-level policy also contributes—including Texas’ speedy grid interconnection process, more liberal land use regulations, and deregulated power market.
Yet it’s also partly an intentional downstream effect of how the IRA was written—the law gives extra tax benefits to renewables built in energy communities (those where the local economy was historically dependent on fossil fuel extraction) and low-income communities, plus it includes specific programs targeting America’s rural areas. Projects in the vast majority of Texas are eligible for at least one of these extra subsidies, as are large chunks of many red states and conservative areas throughout the country. Then there’s just the general fact that exurban areas tend to have more land available for the construction of new wind & solar plants and the IRA heavily supported those forms of energy—at some level, geographic shifts were a necessary byproduct of any renewables buildout. Other states that have benefited the most thus fall into similar patterns as Texas: they tend to have some combination of (in order of importance) bountiful natural sun/wind resources, significant rural land availability, concentrations of poverty, and historic involvement in fossil fuel extraction. For obvious reasons, the Sun Belt states show up especially strong with California, Florida, Arizona, Nevada, and New Mexico all seeing substantial solar investment.
Those trends are projected to continue over the near future. Texas is again poised to benefit most from the renewable energy projects completing over the next twelve months, with 32% of new US batteries, 27% of new solar, and 23% of new wind slated to come online in the next year going in the Lone Star State. Meanwhile, California continues to experience the fastest battery storage buildout in the nation and a large solar boom is going on throughout most of Florida and the Great Lakes region. Yet it also should be said that the clean power buildout has been more evenly distributed between states than the manufacturing buildout, as virtually every state is now seeing some kind of renewable energy construction, and many of them have increased their solar output by over 50% compared to last year. Instead, the distinction within states is more pronounced, with jobs and investment being more rural and suburban than urban.
The Public Investment Boom
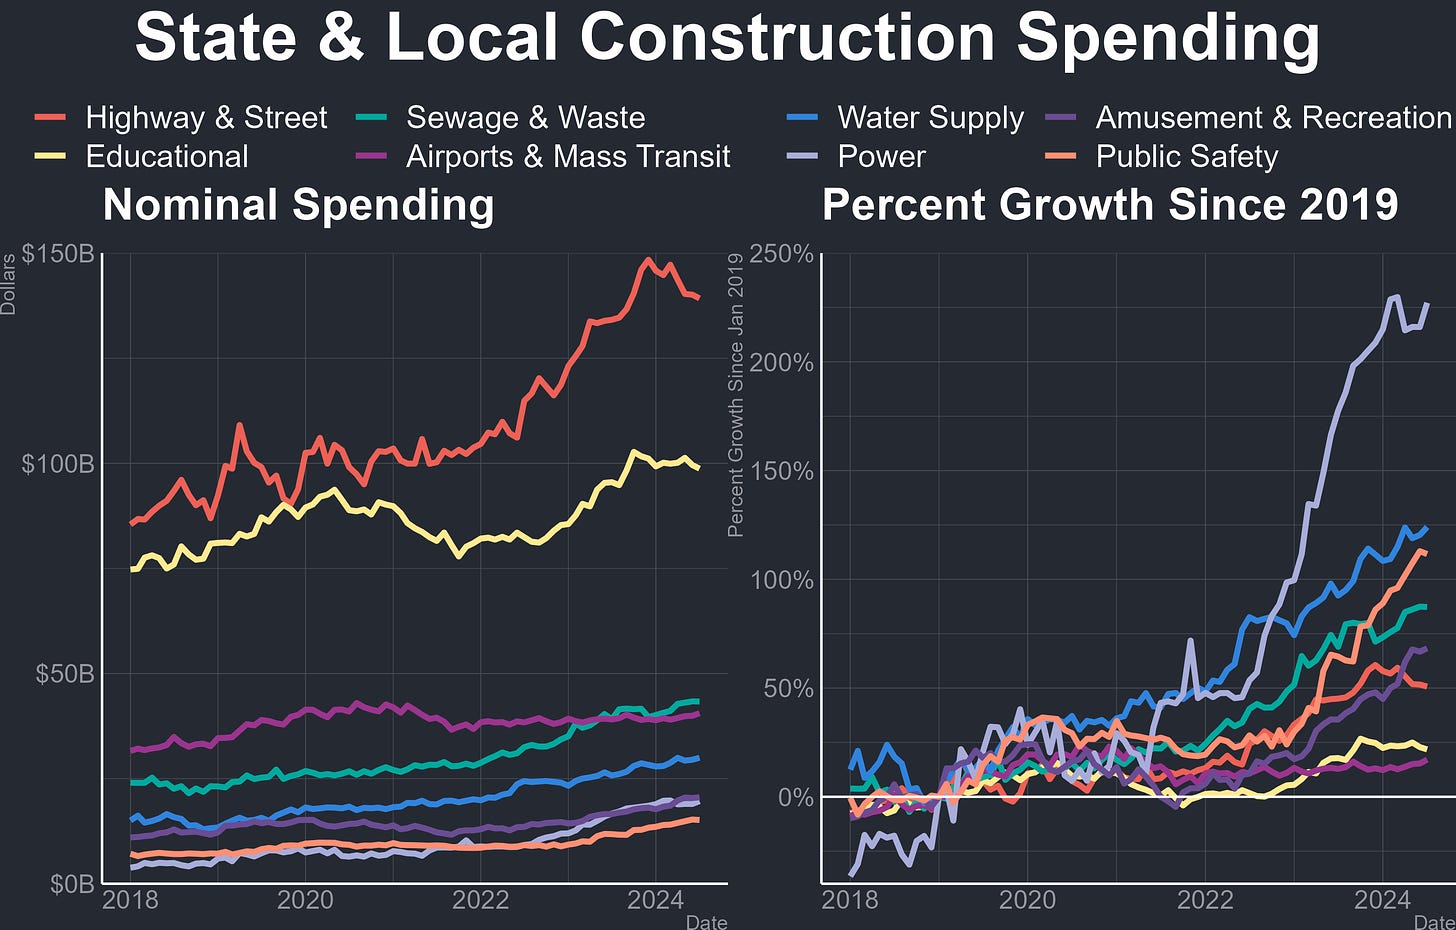
There has also been a nationwide boom in public-sector construction as the Bipartisan Infrastructure Law and Inflation Reduction Act passed plenty of funding for investments in national infrastructure. Almost all of this public sector construction is carried out by states or municipalities, even if the funding itself comes from the Federal level, and nominal US state & local construction has increased by 52% since 2019 (though adjusted for inflation that number is a much, much more meager 8.6%). Roughly half of that state & local construction spending comes down to just two broad categories—roadways and public schools—and highway spending has increased by a monstrous $47B (51%) since 2019 while educational spending has seen a much more tepid $18B (22%) increase. In percentage terms, the largest increase has been the more-than-tripling of spending on public electricity infrastructure thanks to the IRA—with spending on water supply (treatment, pipes, & pumps), public safety (police, fire, & prisons), and waste management (sewage, garbage, recycling) also posting strong gains. The most notable lagging category has been airports & mass transit, where spending has barely budged in the wake of post-COVID travel shifts and reduced appetite for local transit expansions.
Breaking the changes in public sector spending down to the state level, it’s clear that extremely low increases in state & local construction, enough to be easily overwhelmed by inflation, are present across many places in the US. Major states like California, New York, Pennsylvania, North Carolina, and Washington have all seen construction spending increase by less than 25%, leaving them below both the national average and the 27% construction price increases seen over the last 4 years. The two largest of those states, California and New York, have much in common—they are wealthy, dense, unaffordable states that are constrained by persistent housing shortages and thus saw large population losses post-COVID.
Conversely, the largest raw increases in public construction activity came from booming states like Texas, Florida, Georgia, and Utah which saw major growth in the remote work era thanks to their relative affordability and high rates of housing construction. In fact, Texas was actually able to supplant California to achieve the highest public-sector construction level of any state in 2023. The states with largest percent increases in state & local construction activity are those like Louisiana, Mississippi, Missouri, and Arkansas whose traditionally low rates of public sector construction were boosted by Federal programs targeting investment in high-poverty areas, plus Rust Belt states like Michigan, Illinois, Indiana, and Ohio where increased subsidies towards manufacturing have been coupled with higher infrastructure investment.
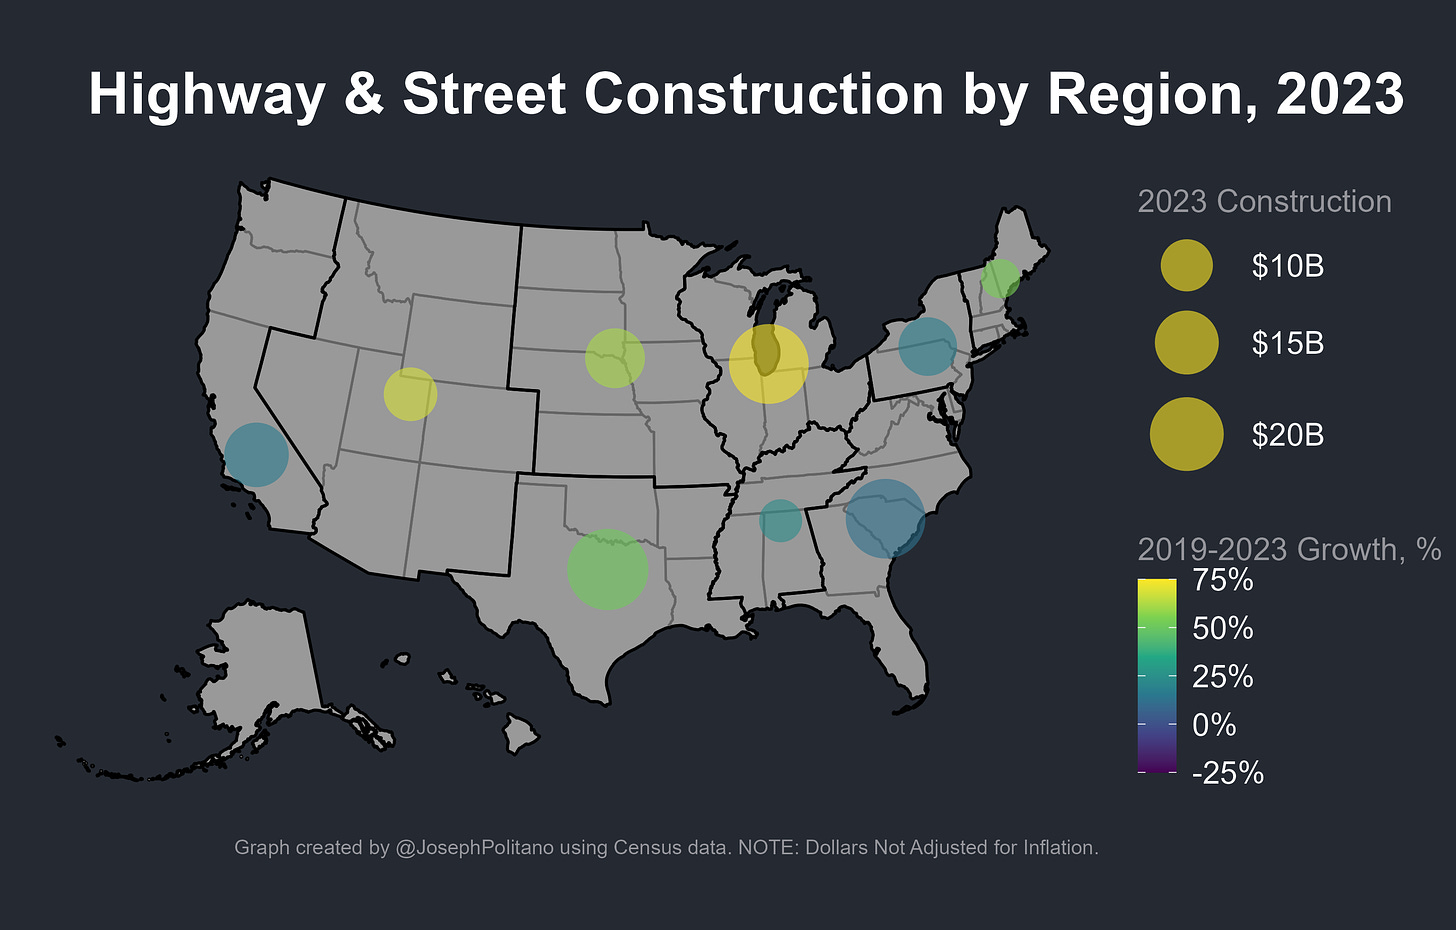
Highways and streets make up the single largest subcategory of public construction in the US, and they’ve likewise seen the fastest growth in nominal terms since the start of the pandemic. Those roadway spending increases had struggled to keep pace with inflation for years—real construction levels dropped 10% between 2019 and 2022—but they have now more than recovered as spending ramps up and materials inflation cools. Roadway spending grew the fastest in the Great Lakes—a notable $9.9B, 74% increase since 2019—followed by the Western Gulf (+$8.2B, +52%), Great Plains (+$5B, +61%), and Mountain West (+$4.3B, +68%). By contrast, the Mid-Atlantic, Pacific Coast, and Southeastern Seaboard all saw weak spending growth far below inflation levels.
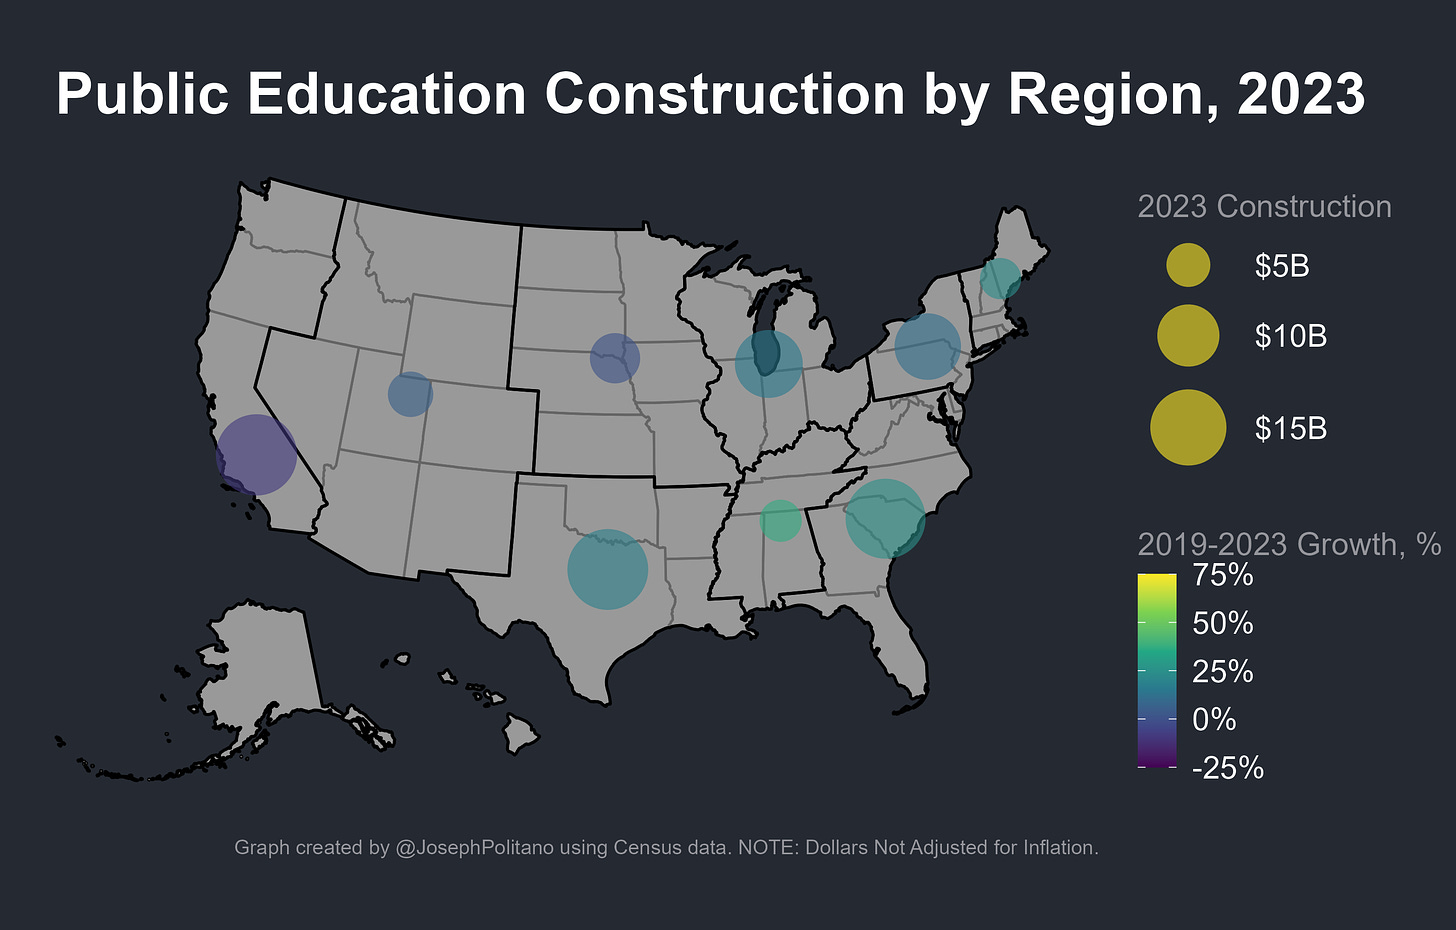
On the educational front, overall construction growth is lower but the gap between regions is narrower. States on the Pacific Coast have seen school construction activity drop by more than 8%, with other regions like the Great Plains, Rocky Mountains, and Mid-Atlantic also seeing weak growth. Public school enrollment in states like California, New York, and Massachusetts has fallen significantly since the start of the pandemic, as housing affordability causes families to move out of state and long-run demographic shifts reduce class sizes. Meanwhile, the Western Gulf and Southeastern Seaboard are the only regions to see nominal educational construction increase by more than 25% since COVID, and are likewise the only regions seeing significant enough in-migration of families to increase student populations.
The smaller subcategories are a more volatile, mixed bag, but the US South still stands out for strong public-sector construction growth relative to the rest of the country. For example, of the $14.5B in increased spending on sewage and waste disposal since 2019, $6.1B came from the Western Gulf and Southeastern Seaboard, as did $4.4B of the $10.5B in increased spending on water supply infrastructure. Overall, public sector construction growth has tended to follow America’s post-COVID migratory shifts, while also being concentrated in states that struggled through the 2010s.
The Job Effects
Finally, there are the labor market effects of this nationwide investment push. The hundreds of billions in new spending require scores of designers and construction workers to turn plans into a reality, and as these investments are completed the new chip fabs, solar farms, and EV plants will require teams of workers to manage and operate. Some industries, like semiconductors, are extremely capital-intensive but labor-light, so massive increases in spending don’t translate to many new jobs, but others, like motor vehicle manufacturing, require scores of trained workers as part of the manufacturing process.
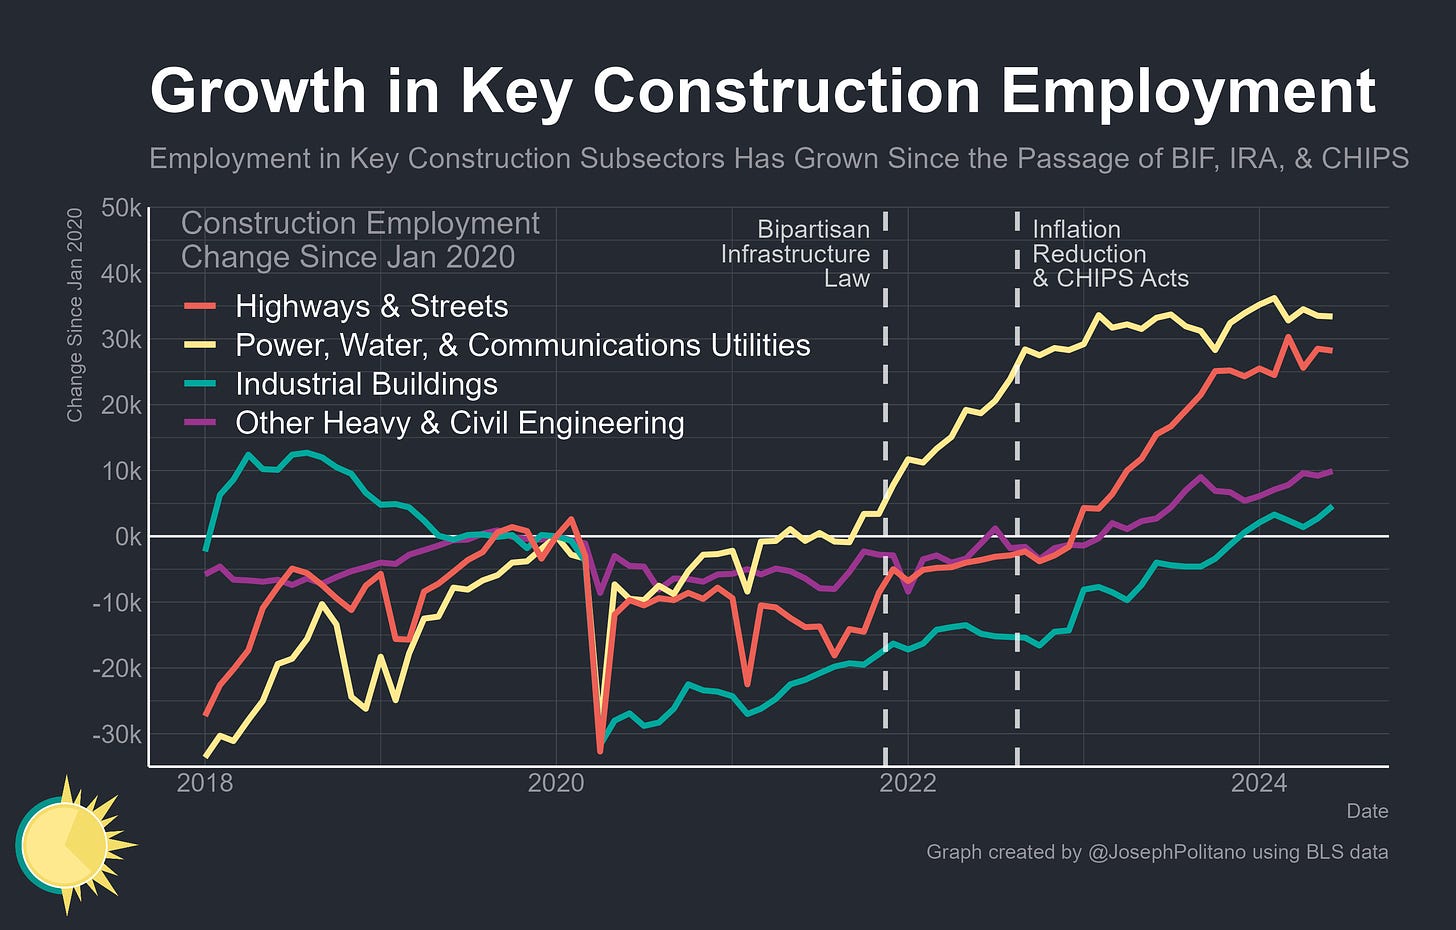
So far, the main employment impacts of America’s investment boom have come in the form of new construction jobs in key subsectors—roughly 105k in total since the late 2021 passage of the Bipartisan Infrastructure Law. At a nationwide level, total water, power, & communication utility construction employment hit a record high in February, roadway construction employment hit a record high in March, and other heavy & civil engineering construction employment hit a record high in June. Industrial building construction employment has also rebounded significantly from its COVID lows, growing by 20k since the passage of the CHIPS Act & IRA.
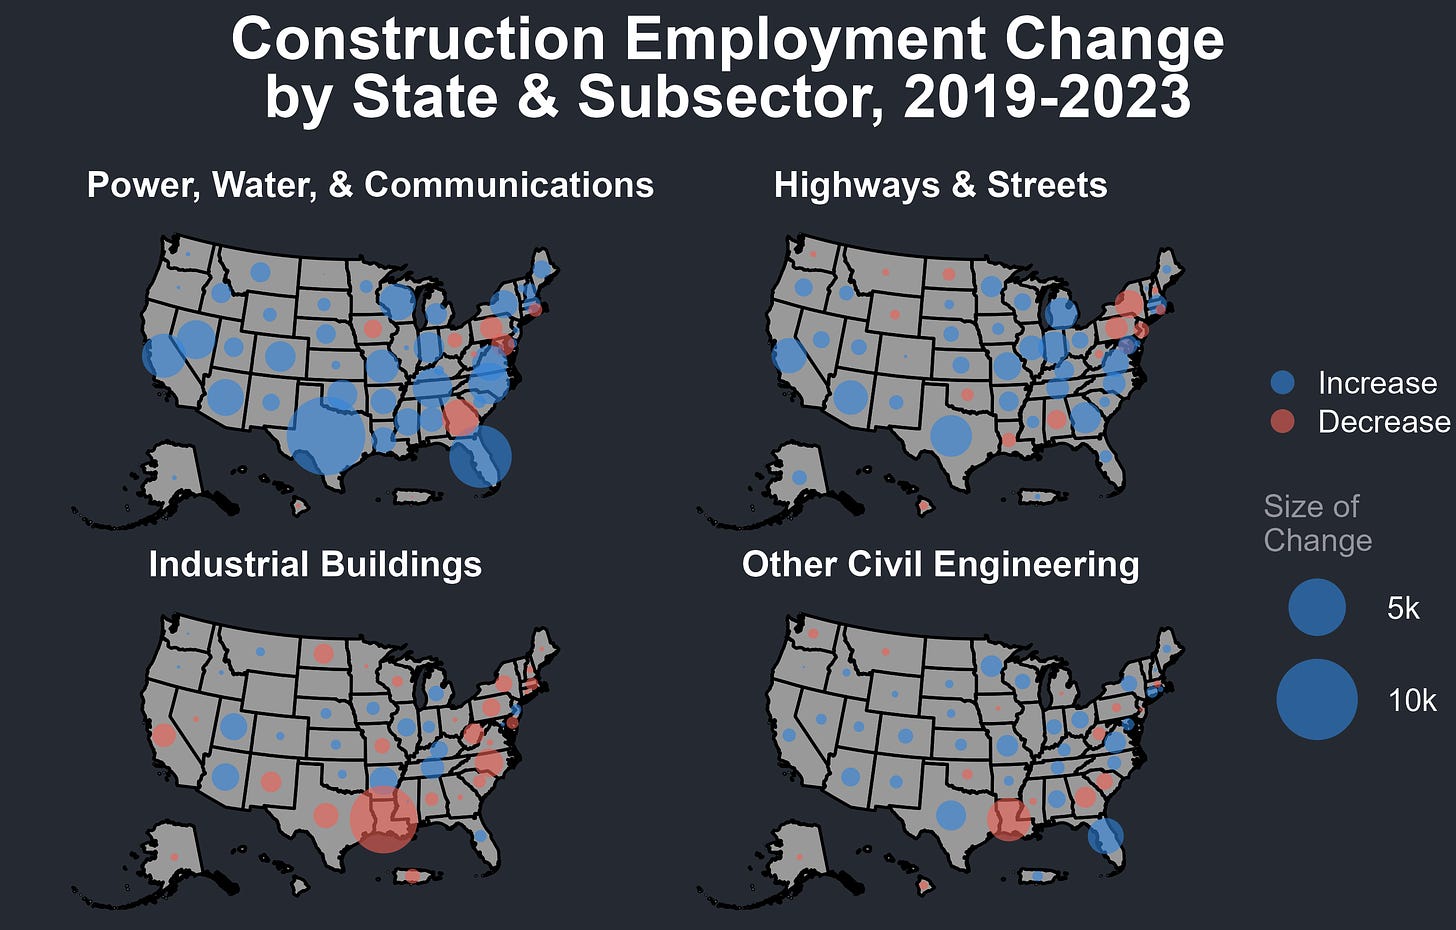
Breaking down employment growth in those key construction subsectors at a state level, the vast majority of states saw some increase in power, water, and other utility construction, with Texas, Florida, and California having the highest job growth and solar-heavy Nevada seeing the fastest percentage increase. In roadways, job growth has been fastest in Michigan, Arizona, and Missouri while Texas added the most jobs overall. Industrial building construction was more of a mixed bag, with Arkansas, a key industrial warehousing & transportation state, actually seeing the largest increase, followed by Arizona with its semiconductor construction boom, and then followed by Utah & Tennessee. Texas performs relatively poorly here, partly because industrial building construction covers some oil & gas-adjacent projects that have struggled post-COVID. Finally, employment growth for all other heavy & civil engineering construction jobs also saw the highest raw growth in Texas & Florida.
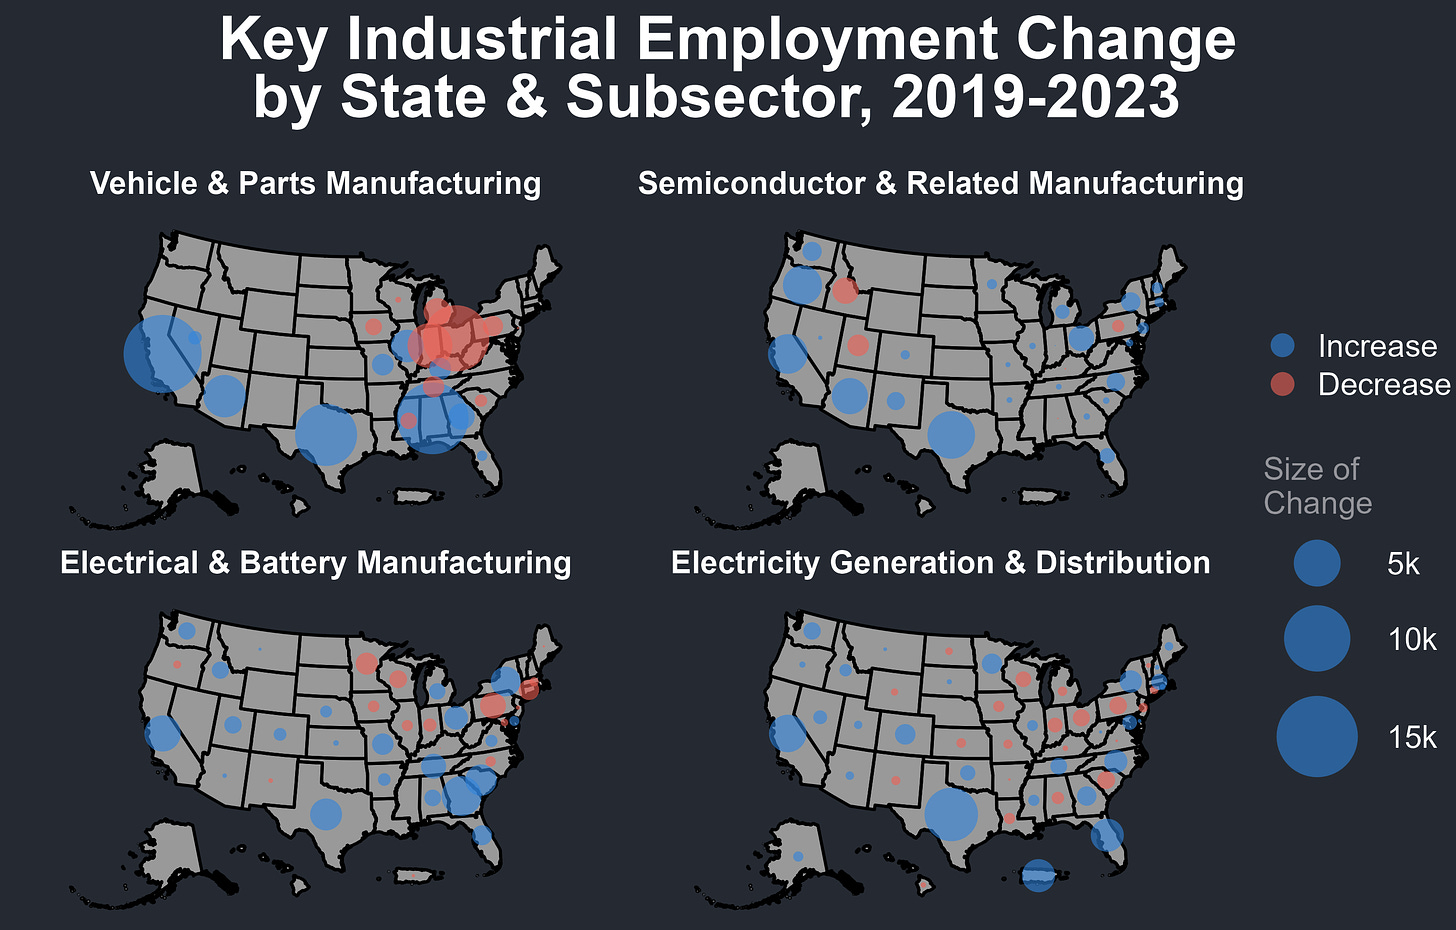
However, growth in operational employment among key industrial sectors has been much more mixed than on the construction side. The strongest performer has been motor vehicle manufacturing, where the US has added more than 100k new jobs since COVID, but those gains are not exclusive to the EV industry. For example, the Department of Energy estimates that the US added 25k jobs in EV & hybrid vehicle manufacturing in 2023 (an increase of 11%), but gasoline & diesel vehicle manufacturing also added 39k jobs (an increase of 2%). Meanwhile, since the passage of the Bipartisan Infrastructure Law jobs in electrical equipment & battery manufacturing have increased by 24k while jobs in electricity generation & transmission have increased by 33k. Finally, cyclical factors have caused the US to actually lose jobs in semiconductor manufacturing since the passage of the CHIPS Act as the industry caught up with demand and eased the shortages omnipresent in early COVID. Employment in these sectors should increase going forward, as projects under construction will need to hire operational workforces as they complete, but it remains to be seen when hiring will accelerate and how many new jobs will be added in total.
Breaking down manufacturing job growth at a regional level, the largest trend is the continuing shift of car manufacturing jobs out of the Rust Belt and into the Sun Belt, with Ohio, Michigan, Indiana, Pennsylvania, and Wisconsin all losing jobs in auto manufacturing. The biggest gainers were California—which benefitted early from the EV boom—then Alabama, Texas, and Arizona. Semiconductor manufacturing job gains were split between old and new hubs, with Texas seeing the most new jobs followed by California, Oregon, and Arizona. Electrical equipment and battery manufacturing job gains were strongest in EV manufacturing hub Georgia (production of EV batteries are categorized as battery manufacturing rather than car manufacturing), and electric generation & distribution employment growth was fastest in Texas, with the state leading its closest competition by a factor of two.
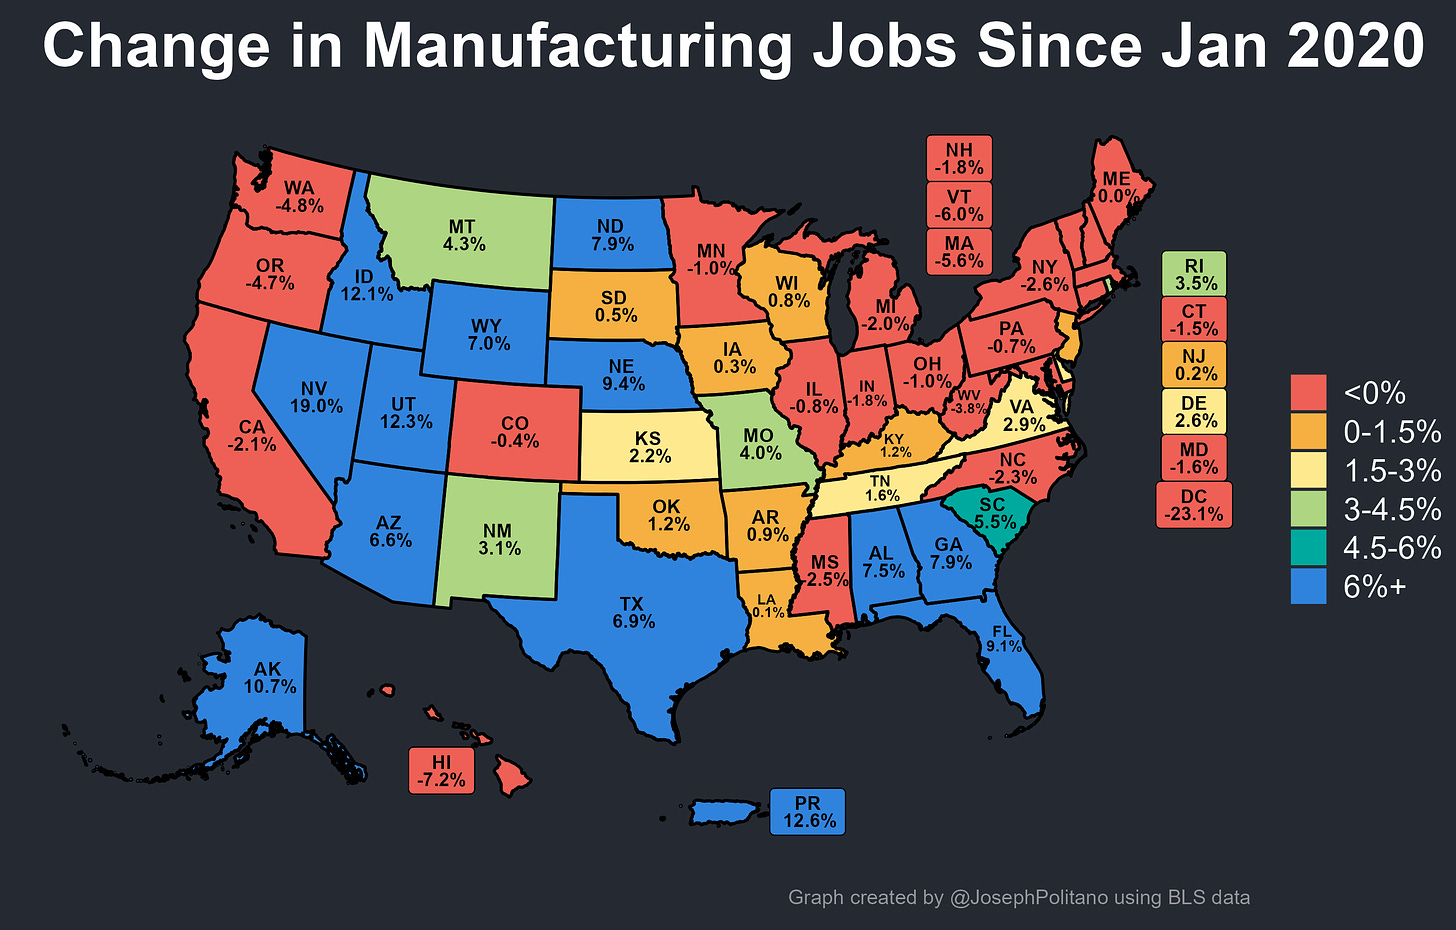
In aggregate, America’s manufacturing jobs continue shifting towards the Sun Belt and Mountain West—Texas, Florida, and Georgia have all seen the biggest raw manufacturing job gains of any state while Nevada, Utah, and Idaho have seen the fastest percentage gains. Meanwhile, America’s industrial policy push has not been able to stop the decline of manufacturing employment in the Rust Belt, which remains below pre-COVID levels and lower as a share of US manufacturing employment than at any point outside the depths of the 2010 and 2020 recessions. So far, spending to defend Rust Belt manufacturing has only slowed the tide of long-run job losses while spending in the Sun Belt has accelerated the region’s overall growth.
Conclusions
I often return to Robinson Meyer’s piece on the underlying logic of the Inflation Reduction Act and this administration’s other clean energy policies—policymakers’ long-run goal was not purely to decarbonize the US, but rather to create a durable American political coalition for decarbonization. Efficient solutions like outright taxing or regulating carbon emissions were considered not politically viable, so instead the decarbonization push had to come in the form of heavy subsidies for clean power production, a tariff-protected EV industry, funding for home energy efficiency upgrades, and much, much more.
Those projects would then give Texas ranchers, Michigan autoworkers, and Pennsylvania homebuilders concrete benefits attached to the clean energy buildout and thus fold them into an electoral coalition that could defend or expand the IRA. There’s some evidence this strategy is already working—no Republican voted for the Inflation Reduction Act when it was passed two years ago, but this month 18 House Republicans signed a letter pleading for Speaker Johnson to spare the bill’s clean energy tax credits from possible repeal efforts. Those signers included representatives from Georgia, Arizona, Indiana, Virginia, Utah, Nebraska, and more—places that have benefitted significantly from Federal investment dollars and have thus been onboarded into the clean energy coalition.
A similar process could happen to semiconductor manufacturing and other industries considered key to growth and national security. The tremendous electoral power of US auto manufacturing comes in large part from the sector’s concentration in midwestern swing states—diversifying chip manufacturing employment from historical hub states like Oregon and California to more swing states like Arizona and Ohio could likewise provide it with similar political defenses.
Of course, there is still a tremendous danger that a politically defended industry can grow into a leech rather than a butterfly—for all the effort that’s gone into shielding the auto industry, Americans do not have a much more efficient or internationally competitive vehicle manufacturing sector than they did 20 years ago. Indeed, the investment boom of the last few years has not yet cured America of its endemic manufacturing productivity problem, and the recent performance of key players like Intel does not inspire confidence. If these industrial policies are unsuccessful, America would have heavily overpaid to achieve decarbonization and security goals at the cost of economic growth. Yet so far, this first push has at least been able to effectively boost American construction activity—that’s actually much better than the last Recession, where federal spending wasn’t able to stop a downturn in investment. That investment boom is already having profound local and regional effects, and to the degree that these industrial policies successfully achieve their long-term goals, they will continue reshaping the geography of the US economy.








This is very good!