The Road to Disinflation
Inflation is Coming Down, but the Journey Now Looks More Bumpy
Thanks for reading! If you haven’t subscribed, please click the button below:
By subscribing you’ll join over 22,000 people who read Apricitas weekly!
Otherwise, liking or sharing is the best way to support my work. Thank you!
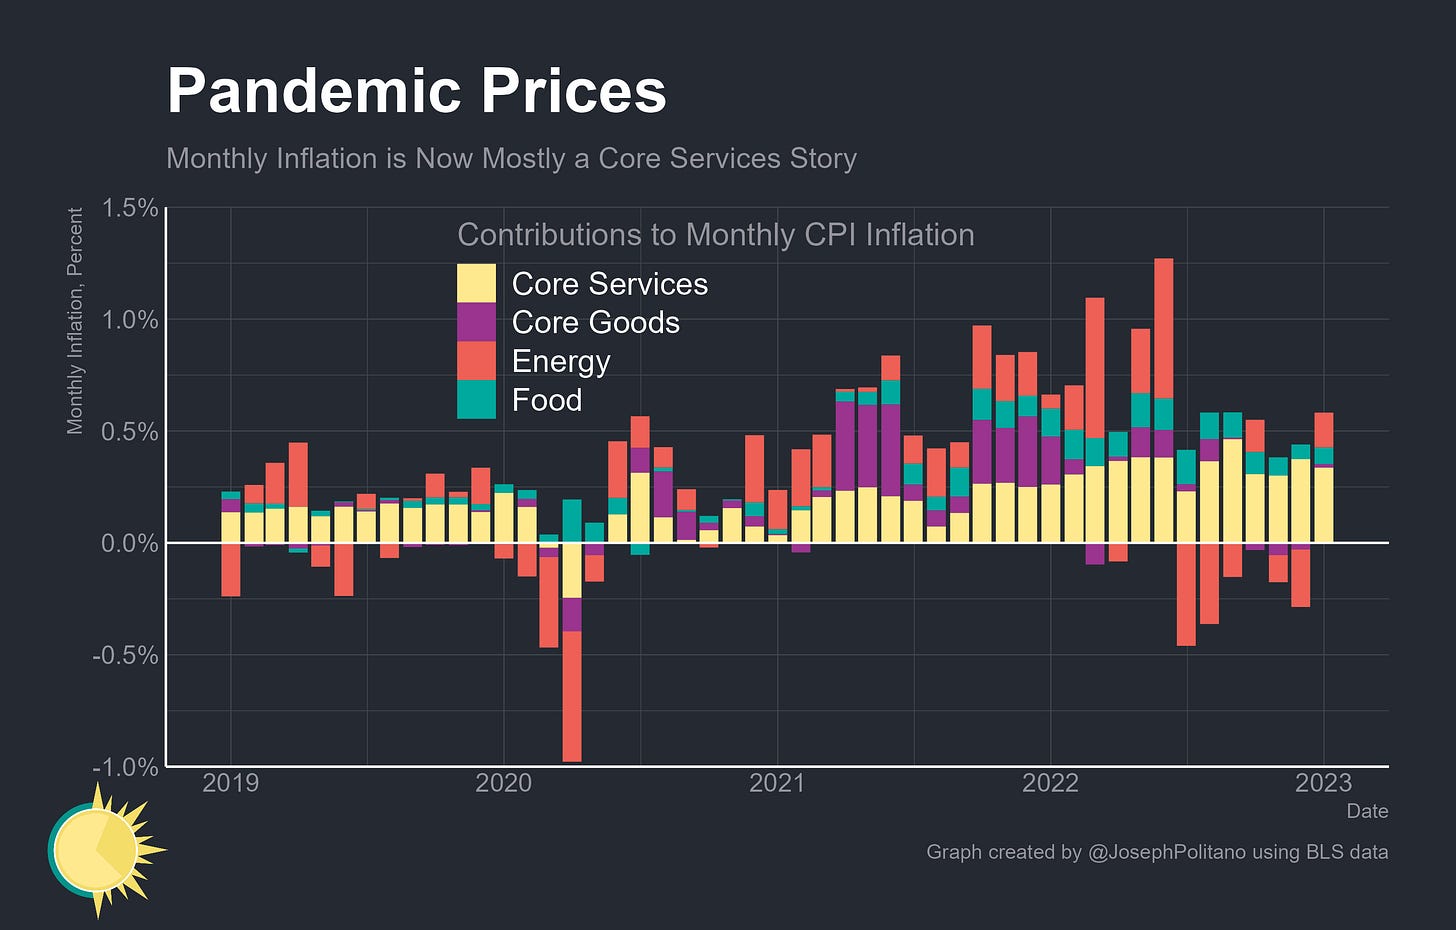
Year-on-year US inflation continues to decelerate, with the headline Consumer Price Index (CPI) growing 6.4% and core CPI (excluding food and energy) growing 5.6% over the last year. January was the first month in several to show positive growth in all major categories—food, energy, core goods, and core services—although monthly inflation is still mostly a story about core services (which includes housing).
Indeed, in terms of year-on-year contributions, only two major categories—food and core services—now make up the vast majority of inflation. Barring a large unexpected surge in gas prices, energy is likely to be a major negative contributor to headline inflation by March at the latest, as gasoline prices were so high this time last year that the fall in prices since then will pull inflation significantly downward. Depending on how the vehicle market develops, core goods could become a negative contributor shortly as well—although stronger-than-expected goods demand and a recent stabilization in used car prices might keep its net contribution very low in either direction.
Combined with the expected upcoming deceleration in rents and other services prices, disinflation (the slowing of the rate of inflation) is clearly in the pipeline. Indeed, in this month’s business inflation expectations survey from the Atlanta Fed, firms’ year-ahead unit-cost inflation expectations declined to 2.9%, the lowest level since July 2021. But the road ahead looks bumpier than it did several months ago, with nominal growth indicators showing outsized strength and markets broadly pricing in higher interest rates for longer in order to contain inflation as recession risks decline.
Services and Rent
Housing inflation has been an outsized driver of price growth recently, with rent prices increasing 8.6% and owner’s equivalent rent—the housing price indicator for homeowners—increasing 7.8% over the last year. That’s the fastest pace in more than 40 years—and in fact, annual rent price growth is only about 0.75% off the all-time highs registered in the 1980s.
Broadly, we know that disinflation in rents is coming from the plethora of higher-frequency indicators of new lease prices, but the timing and strength of that disinflation are still in question. Monthly growth in the rental components of CPI is still near historic highs, and it could take until May or June for base effects to cause annual rent inflation to decelerate significantly.
However, the Fed is more focused on core services ex-housing, a subset of the separate personal consumption expenditures price index (PCEPI) which they believe best reflects the labor-cost-driven pressures of inflation. On that front, there is less progress at the moment—although we will have to wait for Producer Price Index (PPI) data and the full PCEPI release to get a full picture, nowcasts from Employ America suggest year-on-year core services ex-housing inflation will accelerate from 4.12% to 4.3% in January. But the Multivariate Core Trend model—a measure of cyclical inflation persistence from researchers at the Federal Reserve Bank of New York—shows elevated, but dwindling, excess contribution from core services-ex housing prices. In other words, while core services ex-housing prices are still running hot, they are cooling off.
Some more services disinflation also looks to be on the way. To the extent wage-cost pressures are the underlying driver of core services ex-housing inflation, those pressures have abated significantly recently. The White House Council of Economic Advisors developed an index of average hourly earnings in non-housing services to track these cost pressures—and its growth has fallen significantly recently and is 1% above pre-Great Recession levels. This mostly just confirms what the data has been showing for months (a slowdown in wage growth, especially in low-pay industries like food service and retail trade) but the index does improve our ability to forecast nonhousing services inflation.
However, businesses are still forecasting wage cost pressures to remain slightly elevated over the next year. More data released today by the Atlanta Fed shows that firms expect labor costs to contribute significantly more than normal to unit costs over the next year while nonlabor costs are expected to contribute only slightly more than normal. Firms are still souring on the economy, though—they perceive their sales as below normal levels and expect falls in sales levels to be deflationary over the next year.
Energy and Goods Disinflation
Leaving the core drivers of inflation, we are also likely to get some idiosyncratic disinflation from goods and energy prices as supply chains and the global energy situation continues to improve. Gasoline prices, relative to the extreme highs of mid-2022, are comparatively low, and will therefore likely be a significant negative contributor to inflation shortly. Even electricity and utility prices are looking to cool in the short term as lower spot natural gas prices pass on to consumers amidst this unusually warm weather.
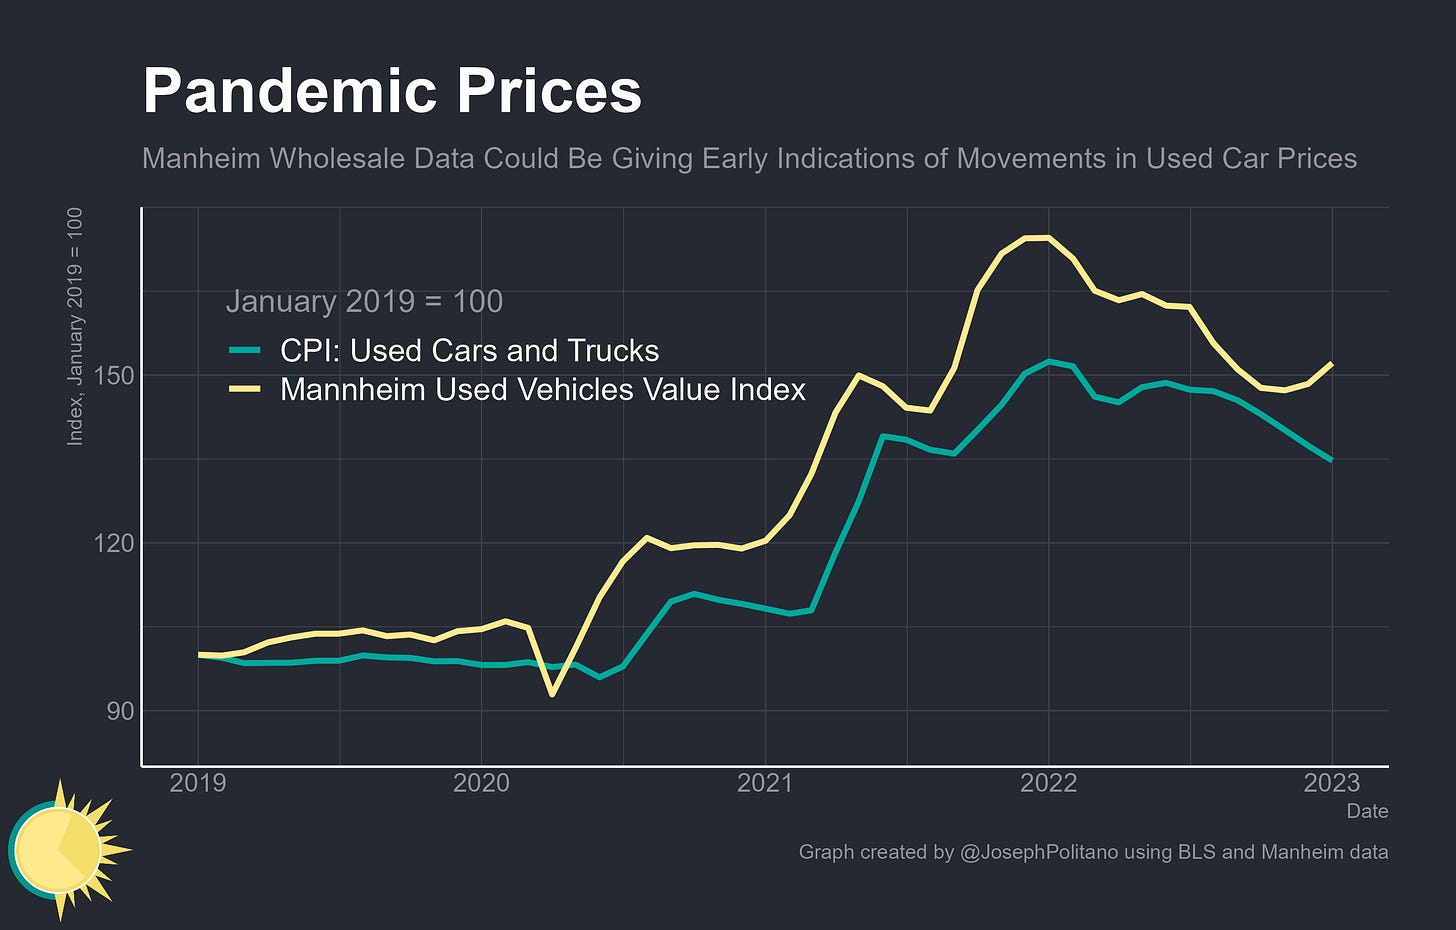
Automobiles, though have a gloomier outlook. Used cars have been the biggest sole source of disinflation throughout 2022 as they unwind the massive 50% price increases from the first two years of the pandemic. However, wholesale used car prices have stabilized (and even increased a bit on a seasonally adjusted basis) in recent months according to data from both Manheim and Black Book.
That’s partly because motor vehicle assemblies have once again taken a dive in recent months among supply-chain issues. The cumulative backlog of “missing” new motor vehicle production since the start of the pandemic has grown to more than 4.6M vehicles—nearly half a year’s output at January’s rates. It’s a reminder that even as material cost pressures and supply chain issues fade, they still remain more present than during the pre-pandemic era.
Conclusions
Broadly, financial markets still believe the Fed will get the job done—regardless of what it takes—and market participants think a recession is less likely than before even as risks remain high. Market-based measures of 5-year inflation expectations are nearly square in the midrange of what would be consistent with the Fed’s target, and longer-run expectations actually remain below target.
But the path to disinflation now looks longer and a bit bumpier than before. Revisions to seasonal adjustments have made recent inflation data look stronger than we thought, nominal income and spending growth remain elevated, and nearly all of the rate cuts previously expected for 2023 have been priced out by financial markets. Intercontinental Exchange’s inflation expectations index, derived from a variety of market data, now expects CPI inflation to end the year at nearly 3% instead of the 2.5% it expected in early January. Inflation may still not look permanent and structural, but it looks a bit more common and persistent.


Great overview of the current inflation situation. I appreciate the focus on the goods sector, as from my understanding of the recent research, the supply side issues actually have much larger effects not only because of lag effects but also they are still present - as you highlight in the car industry, but also equipment, bakeries and so on. Research by Lorenzoni and Werning show that supply side needs to fully return for inflation pressures to subside (not just ease, as many point talk about). The recent data published today by the New York Fed, show an uptick in the goods sector. I went over this research and posted a description of it on my substack, in case you're interested in more details.