Thanks for reading! If you haven’t subscribed, please click the button below:
By subscribing you’ll join over 11,500 people who read Apricitas weekly!
Otherwise, liking or sharing is the best way to support my work. Thank you!
US economic data isn’t adding up.
Gross Domestic Product (GDP) is arguably the most commonly-cited measure of economic size and growth. But it has a less-beloved little sibling—Gross Domestic Income (GDI). Whereas GDP takes an expenditure approach, summing up all the spending in the economy, GDI takes an income approach, summing together all the income in the economy. Since one person’s spending is another person’s income, the two measures should be precisely equal; spend $500 on a table and the table-maker must earn $500.
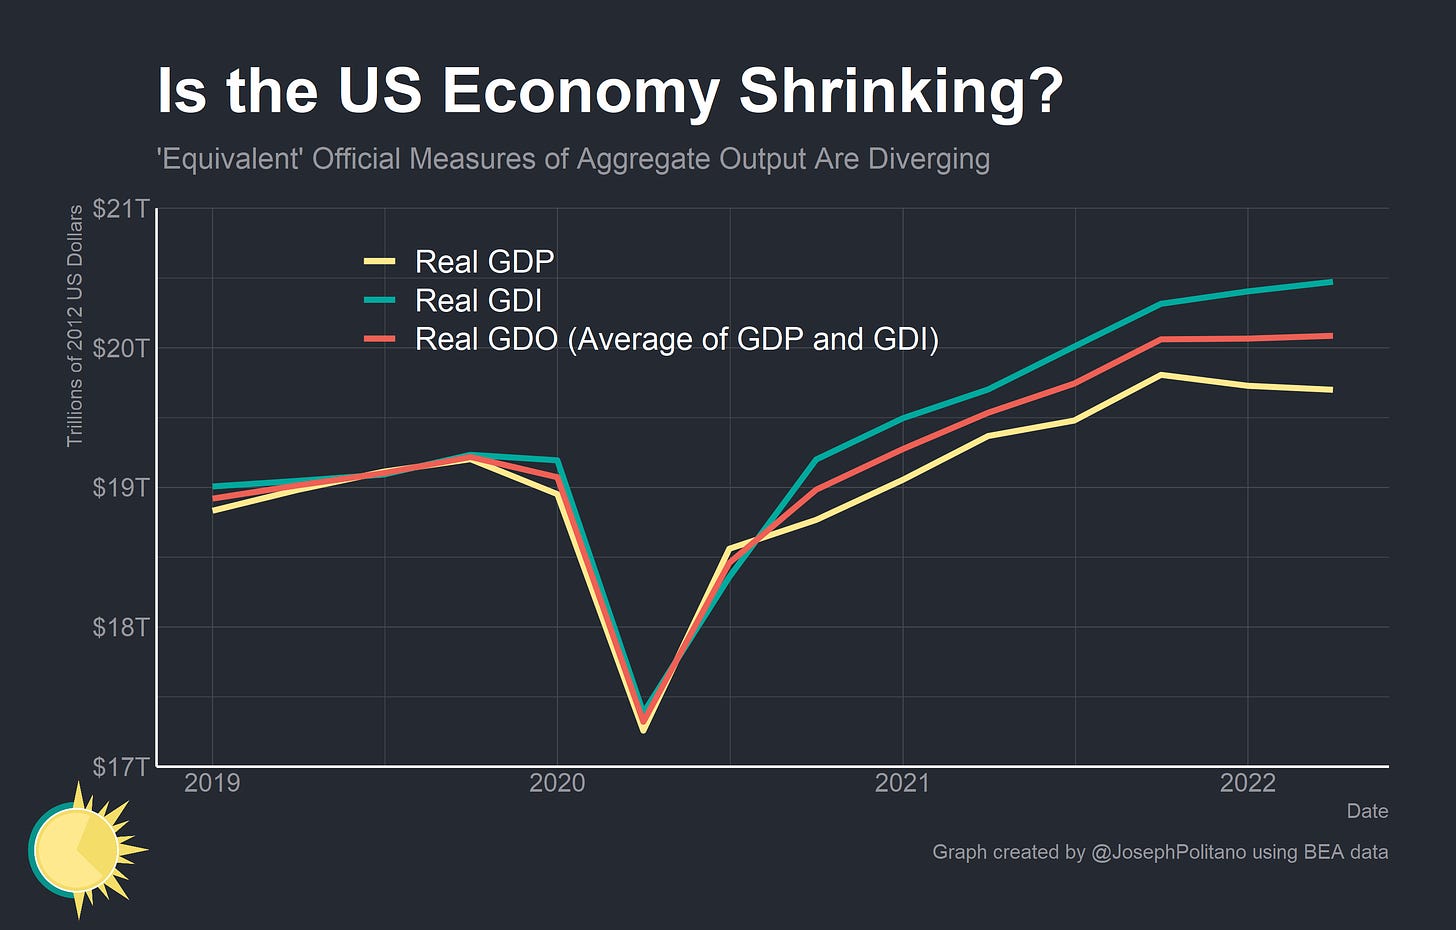
However, official statistics for GDP and GDI have now completely diverged—and the gap between the two stands at nearly 1 trillion dollars.
If you believe real GDP then the economy has been shrinking for half a year. If you believe real GDI then the economy is still growing (albeit at a slower-than-normal rate). On the flip side, if you believe nominal GDP then total spending has slowed down to a level consistent with ~5% long-run inflation, but if you believe nominal GDI then incomes are growing at a level more consistent with ~8% long-run inflation.
So what’s causing the gap, and which data series should we trust? I have some theories, but first—why is this important?
False Equivalence
A lot of ink was spilled last month about whether or not the US was in a recession—mostly because 2 consecutive quarters of negative GDP growth is a popular heuristic for a recession. GDI data is supposed to be equivalent to GDP, so theoretically the idea that real GDI increased at 1.8% annualized in Q1 and 1.4% annualized in Q2 should counteract some of those recession fears. To be fair, pundits and policymakers always tend to place a higher weight on GDP data (and not just because it comes out first). Here’s the Handbook of Methods from the Bureau of Economic Analysis (which puts together both the GDP and GDI data) basically saying to do as much:
In general, the source data for the expenditures components [GDP] are considered more reliable than those for the income components [GDI], and the difference between the two measures is called the “statistical discrepancy.”
That statistical discrepancy now sits at the highest level in history, with the important caveat that the gap may close when recent data is further revised. What data series you trust has implications beyond output growth, too. Nominal (i.e., not inflation-adjusted) spending/income grew by 10% annualized over the last 6 months if you believe GDI and 7.5% annualized if you believe GDP. That matters for future inflation because the prices of certain items—most importantly rents—only adjust intermittently and with a lag. If nominal growth was truly 10% annualized over the last 6 months then rent price growth should remain elevated for much longer than if nominal growth was 7.5%—though both numbers are much larger than the 4-5% nominal growth that would be approximately consistent with the Federal Reserve’s long-run inflation target. So what’s driving the massive gap?
Hypothesis 1: Investment is Underestimated
This is the favored theory of Matt Klein, who caught this discrepancy before most and has put out several great (paywalled) pieces discussing possible ways to reconcile the gap. His central thesis is that GDP data is likely severely underestimating fixed investment by misclassifying certain kinds of spending as “intermediate input consumption.”
Intermediate input consumption is supposed to be excluded from calculations of GDP simply to prevent double-counting. If I buy $250 in wood from a lumberjack and craft it into a $500 table then our total economic output is the $500 table—the $250 in wood has been used up as an intermediate input. Outside of hard manufacturing, however, things get messy. Is video editing software a fixed investment by movie companies, or is it an intermediate input in movie-making? Is a data-warehousing company buying new servers making an investment or are the servers just intermediate inputs in data storage? If new servers are fixed investments, then what if the company contracts with a cloud service provider instead of buying its own servers? The BEA has official answers for all this—but often struggles to perfectly categorize things.
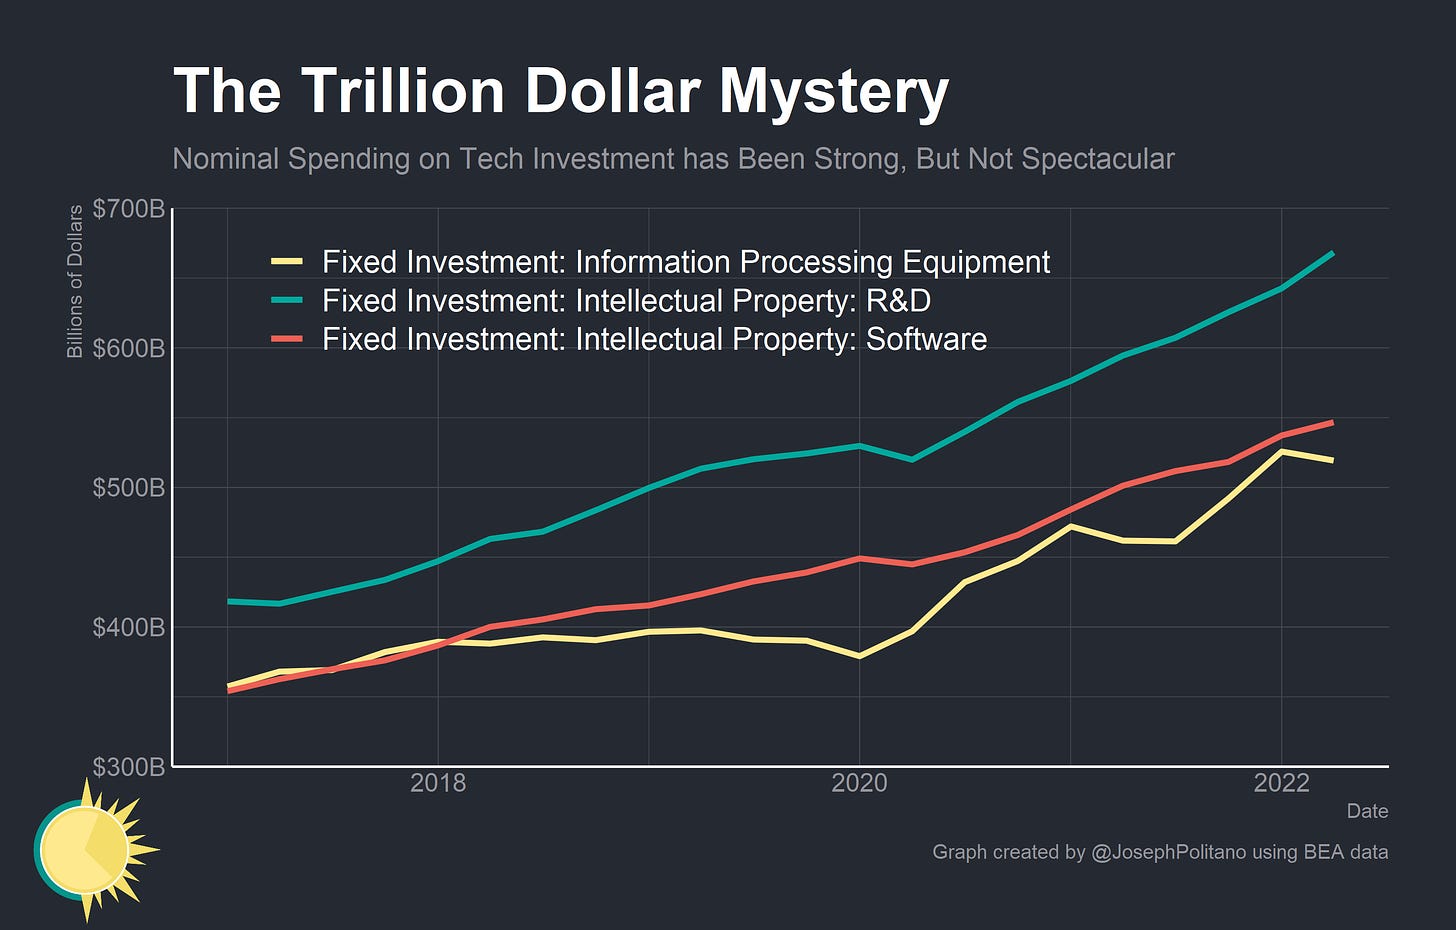
If you look at fixed investments in information processing equipment (computers, computer accessories, etc), software, and R&D, there is no dramatic acceleration in aggregate nominal investment at the onset of the pandemic. That’s despite the work-from-home revolution, acceleration of e-commerce usage, and the first price increases for computers in decades. Combined with the increase in intermediate input consumption within the information and professional services industries—which should be overly susceptible to this kind of issue thanks to their high spending on technology—this makes underreporting of fixed investment the most likely culprit.
The size of this underestimation would have to be rather substantial, though—quarterly fixed investment would need to be 22% higher than currently reported to close the GDP-GDI gap. That’s a rather high number—it would suggest a massive boom in domestic investment consistent with a much more robust economy than real GDP data currently shows—but it is decidedly less of a stretch than many of the other possibilities we will discuss.
Hypothesis 2: Census Manufacturing Data is Underestimating Output and Investment
If I build a table in January, put it in storage, and then sell it in May, I have built up and subsequently drawn down inventories across quarters. BEA considers this an investment; in judging GDP they don’t care about when I sold the table, they care about when I made the table. The production occurred in Q1, at which point I “invested” that production in increasing my inventories by 1 table. Then in Q2 consumption of the table-buyer increased, but was perfectly offset by a reduction in inventories, leaving no net impact on Q2 GDP.
That’s a nice story but it’s fundamentally much more difficult to manage in practice. Thousands of manufacturers, retailers, and wholesalers have trillions in inventories that they are constantly accumulating, drawing down, and exchanging. That makes inventories one of the most volatile components of GDP data, especially amidst a pandemic where inventory management is complicated by supply-chain disruptions. Plus the BEA’s method of calculating the change in inventories is complicated, to say the least.
Separating Census Bureau published inventories (which are on a non-LIFO [Last-in First-Out] basis) into those that were reported on a LIFO basis and those that were reported using other accounting methods.
Construction of current-period inventory price indexes for each industry, and for manufacturing and for publishing, each stage of fabrication.
Construction of monthly cost indexes for each industry, and for manufacturing and publishing, each stage of fabrication.
Revaluation of the book-value inventories to yield constant-dollar and current-dollar change in inventories.
Calculation of the IVA [Inventory Valuation Adjustment].
Calculation of current-dollar and constant-dollar stocks.
Steps two and three are the most critical here—monthly cost indices are constructed for each industry/stage of fabrication and book-value inventories are then revalued so that the BEA can determine inventory accumulation or drawdown. In other words, BEA wants to know “how many current dollars worth of real inventory did businesses accumulate or drawdown this quarter?” but has to calculate that by using complicated price and valuation adjustments on measurements of existing inventories. Those price and valuation adjustments get even more complicated in moments of high and volatile inflation like we’ve seen recently. That could lead to systemic misestimation of inventory growth—which directly affects GDP data.
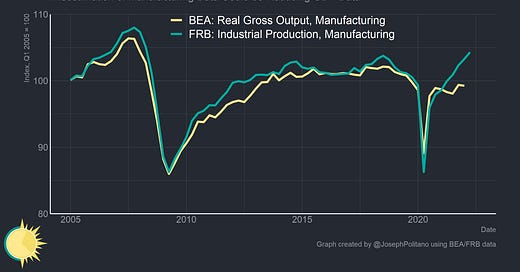
The main source of manufacturing inventory data is the M3 Manufacturing survey from the Census Bureau, and there is decent evidence that M3 (or the Producer Price Index (PPI) data used to adjust it) could be causing issues. BEA’s estimate of real gross manufacturing output (which includes the output of intermediate goods alongside the output of final goods) historically tracked well with the Federal Reserve’s separate measure of industrial production, but the two have now completely diverged recently. BEA’s (separately derived) estimates of real GDP for manufacturing are near a record high, meaning the only way BEA can square rising GDP with decreased gross output is a dramatic reduction in manufacturing’s real consumption of intermediate inputs—which seems highly implausible.
Hypothetically, underestimations in M3 inventory data, overestimations in PPI price growth, or other complex issues with the specific change in inventory calculations could be causing BEA to underestimate inventory growth, and thereby GDP. The underestimation here, however, would have to be massive—change in private inventories has never exceeded $250B and we are asking it to close a $1T hole. Thankfully there’s more to the Census story than just inventories—namely that data on Manufacturers’ shipments of nondefense capital goods also comes from the M3 survey. Earlier this year that data series was revised down 10%; positive revisions or data catchup could push private fixed investment up as well.
Hypothesis 3: Profits are Overestimated
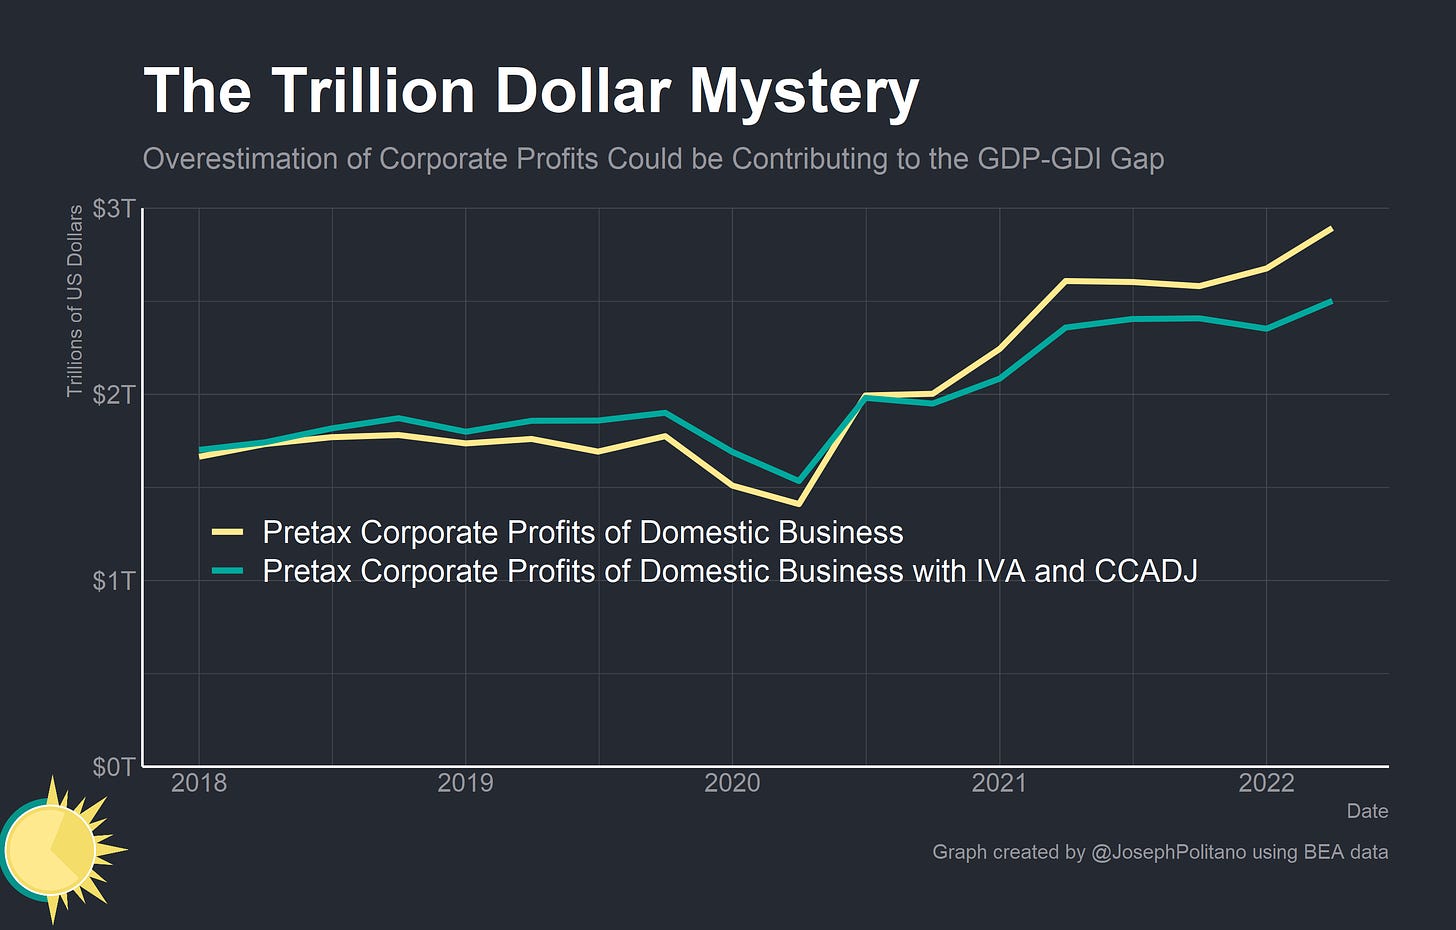
Corporate profits are notoriously volatile and hard to estimate—even in the best times. Interrelated with the issues surrounding inventory calculations in the GDP numbers are complicated inventory adjustments to corporate profits in the GDI numbers. The general idea is that if a company builds a table in Q1—when table prices were $500—and sells the table in Q2—when table prices were $550—the BEA should adjust the company’s profits down by $50 to account for the change in inventory valuation from Q1 to Q2. Profits should reflect the sale prices of goods when they were manufactured—which in practice is hard to adjust for. If price increases or total sales out of inventory are underestimated, corporate profits could plausibly be inflated.
There are more boring issues like sampling biases towards larger companies that could affect profit calculations, but the scale of downward revisions necessary to bring GDI in line with GDP is almost implausibly high. Quarterly corporate profits would have to be revised down 40% to close the GDP-GDI gap, erasing all the increases since 2020 and leaving profits below pre-pandemic levels before adjusting for inflation. That kind of collapse would likely be well appreciated by public financial markets before it showed up in GDI.
Hypothesis 4: Aggregate Wages are Overestimated
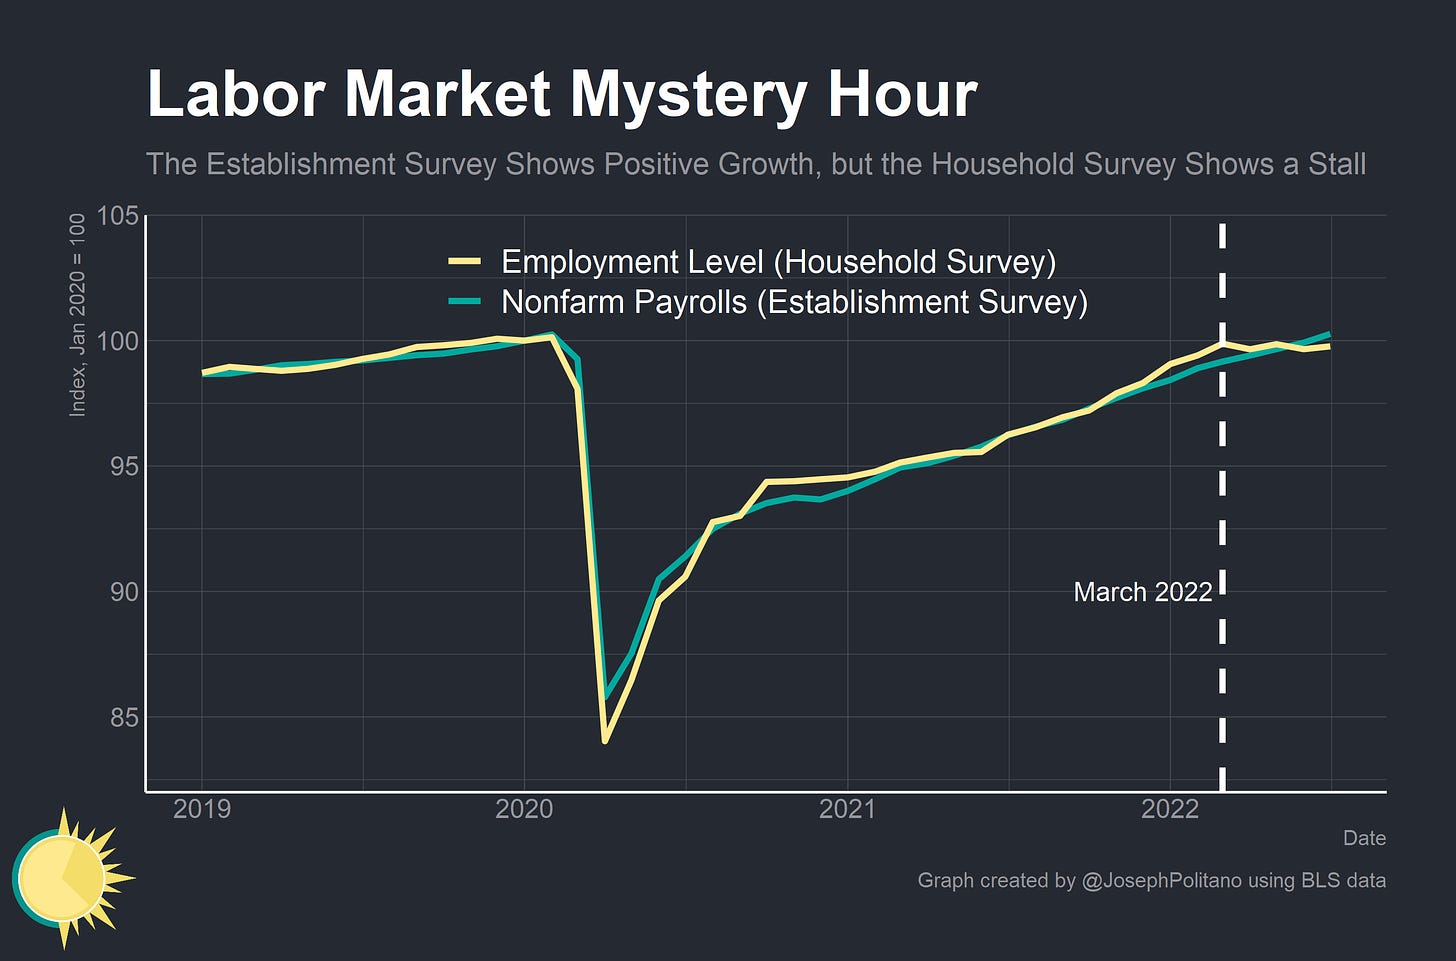
For initial quarter-to-quarter estimates, the BEA uses data from the establishment survey to extrapolate between the more comprehensive data from the Quarterly Census of Employment and Wages (QCEW). Plausibly, if data from the establishment survey is overestimating employment or wage growth then GDI would be overestimating wages and salaries. The overestimation would have to be extremely substantial to close the GDP-GDI gap—equivalent to nearly 10% of total labor income or all aggregate labor income growth in the last year. The added wrinkle is that preliminary updates to benchmarks for the establishment survey show that job numbers were nearly half a million higher than establishment survey data suggested at the end of Q1. So unless revisions to recent data are substantial and highly negative it will be hard to close the GDP-GDI gap through wages alone.
Hypothesis 5: Trade is Miscounted
This one is a bit of grasping at straws, but it is maybe possible that trade data is somehow being confounded due to backlogs at American ports. The US government has very comprehensive tracking of shipping exports and imports through Customs and Border Protection, but that tracking only acknowledges products as imported once they clear through US ports. Clearing the backlogs at major ports has previously interacted with seasonal adjustments to temporarily over-or-underestimate GDP; in Q4 2021 GDP data got a temporary boost due to lower-than-normal imports and in Q1 seasonal adjustment of net exports was a particular drag on GDP as Q1 is normally a weak month for exports. It’s possible that clearing of import backlogs could result in some timing issues that cause temporary underestimation of inventories if cargo is officially imported in one quarter but not yet recorded as inventory, but again this is the least likely of the possible theories I can come up with. If it’s a temporary misestimation issue then it should resolve quickly, but if it’s not a temporary issue then trade is likely not to blame—even if the entire US trade deficit was closed, which is highly unlikely, the GDI-GDP gap would only barely be fixed.
¯\_(ツ)_/¯
So what do we make of all this? It’s hard to tell at the moment—it might take years before more comprehensive data and revisions bring GDP and GDI together. Only then can we discern the culprits—and I do think it’s likely that there are multiple culprits here.
GDI generally seems to match the facts on the ground a bit better: rapid core inflation, slow but positive real growth, and a relatively strong labor market. Also, when the two measures diverge historically GDP tends to get revised towards GDI more than the other way around. But if you want to take the moderate path just average the two—that measure (nicknamed Gross Domestic Output (GDO)) essentially shows stagnation in real output, and advocates say that it forecasts better than GDP or GDI separately.
This historically large discrepancy should be a lesson on how even the most robust data collection processes can bend or break when put under tremendous stress. However, even with the massive GDP-GDI gap, both measures are essentially saying the same thing from a bird’s eye view: nominal growth is extremely high, real growth is relatively low or negative, and inflation is still high.






There are multiple likely explanations:
First, the data is preliminary and still adjusting to COVID-related changes to the surveys.
Second, CPI and PCE inflation surveys had to adjust methodology in March 2020.
Third, trade imports has temporarily surged in official statistics because of supply chain bottlenecks.
I could go into more detail, but the overall point is that:
1. GDI/GDP average reflects the recent economic performance better than GDP or GDI.
2. Price surveys are backwards looking, using slightly outdated baskets. Prices today are likely higher than the GDI/GDP estimates say.
3. GDP tends to decrease (on net) from import surges while GDI increases (on net). This shouldn't be true on an annual basis but it is on a quarterly basis. Just depends on when the customs agency books the import & export.
Why this statistical discrepancy seems to start mid 2020 may be of relevance?