The views expressed in this blog are entirely my own and do not necessarily represent the views of the Bureau of Labor Statistics or the United States Government.
There’s been plenty of ink spilled on inflation recently as the unprecedented efforts of the Federal Reserve and Federal Government to support the American economy intersect with the post-vaccine reopening of much of American life. The Consumer Price Index, the most widely circulated measure of inflation in the United States, hit 5% year-on-year inflation in May 2021 with a full 0.6% inflation in May alone. The Federal Reserve’s new Flexible Average Inflation Targeting regime has also made it a goal for inflation to persist slightly above the Fed’s usual 2% target rate in order to compensate for periods of low inflation and weak aggregate demand. Inflation expectations, the amount of inflation market participants expect over a given period, play a critical role both in assessing the public’s beliefs about inflation, evaluating the effectiveness of the Federal Reserve’s new framework, and predicting future inflation rates. This is especially true because inflation expectations directly change how rational agents behave within the economy, meaning that changes in expectations can directly influence changes in actual inflation.
In this post, I want to explore the different measures of inflation expectations in the United States and their relative accuracy in predicting actual inflation in the hopes of informing an evaluation of today’s inflation expectations. I will show that inflation expectations have been well-anchored and fairly accurate, often overestimating realized inflation over the last two decades. In light of current inflation expectations, the primary danger still lies in inflation undershooting the Fed’s targets, not overshooting them.
TIPS
TIPS are Treasury Inflation-Protected Securities, a unique type of US government bond where the principal of the bond is tied to inflation. Every six months, the principal value of the bond is recalculated based on the inflation that occurred and interest is paid out on the new principal. By taking the yield of traditional Treasury Securities and subtracting the yield on equivalent TIPS, we can determine the expected inflation to the securities’ maturity.
For example, by taking the yield on a 5-year Treasury Note and subtracting the yield on the 5-year TIPS, we can calculate inflation expectations over the next five years. This is called the “5-year breakeven inflation rate”, and it comes alongside 10-year and 30-year breakeven inflation rates. Since TIPS were introduced in 1997, it is only possible to analyze breakevens based on the 5- and 10-year TIPS, and I must leave the analysis of 30-year breakevens to the economists of the 2040s.
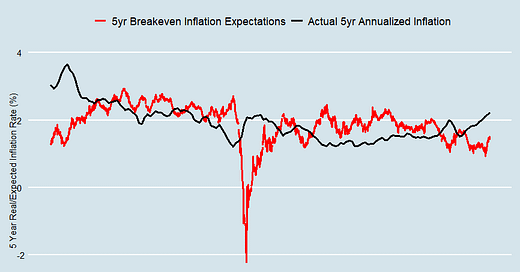
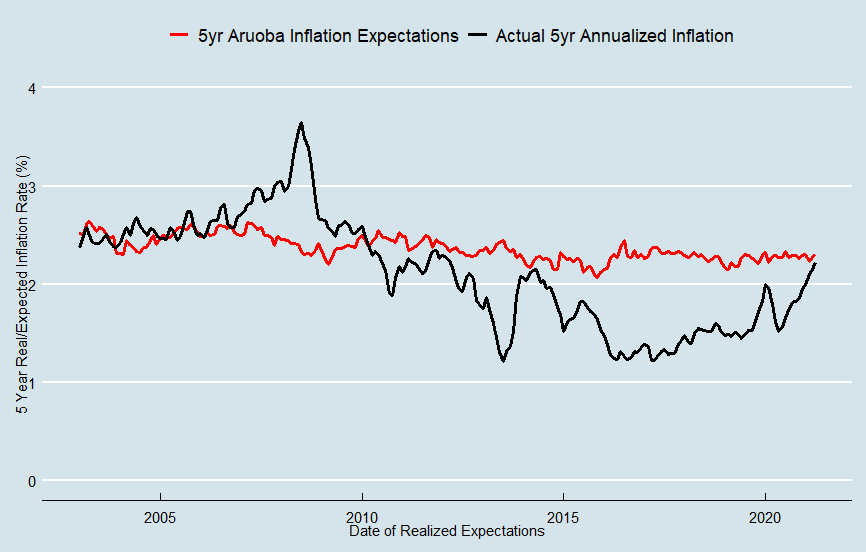
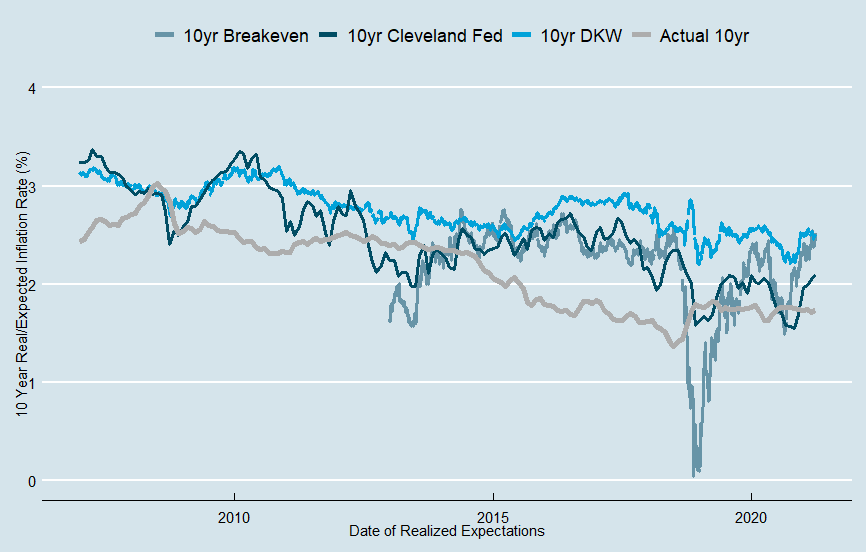
So how accurate are breakeven inflation rates? To measure this, I took the breakeven inflation rate and compared it to annualized inflation, measured by the Non-Seasonally Adjusted Consumer Price Index, the inflation index used by TIPS. For all the charts in this blog post, the breakeven inflation rate and the actual annualized inflation rate are plotted by the date the expectations were realized. So for the date 2015 on the charts, the 5-year breakeven inflation expectation rate represents expectations from 2010 and the actual 5-year annualized inflation represents real inflation from the period 2010-2015.
In the chart above, you can see that the 5-year breakeven inflation is fairly close to the actual 5-year annualized inflation rate. The main exceptions are the periods ending 2013-2014, when expectations from the 2008-2009 global financial crisis dramatically undershot actual inflation and after 2015 when expectations were consistently above the actual inflation rate. It’s also worth noting that shorter-term inflation expectations tend to fluctuate significantly based on news, with oil price changes being one of many examples.
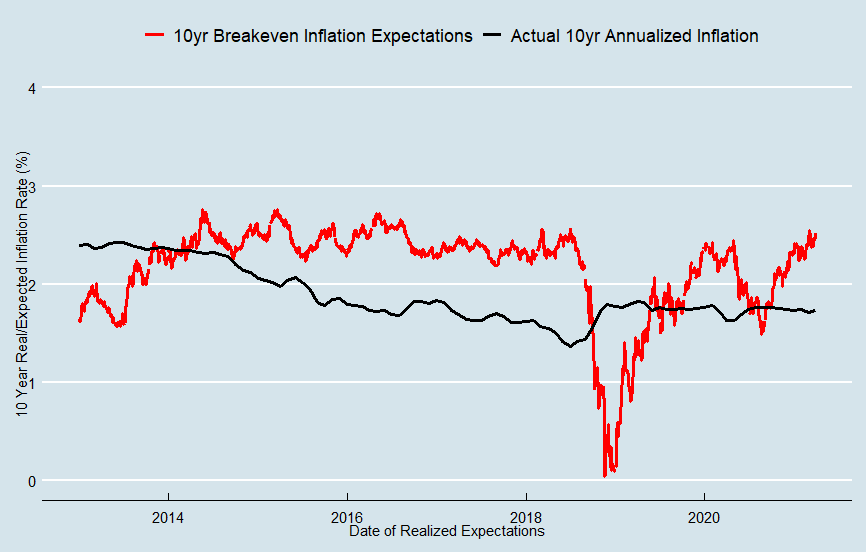
For the 10-year breakeven inflation rate, expectations consistently overshot actual inflation for the periods ending 2014-2018 and again dramatically undershot actual inflation for the periods ending 2018-2019. The financial crisis is responsible for both of these shifts, as inflation for the 10-year periods ending between 2014-2018 was brought down dramatically by the global financial crisis and the crisis itself meant that inflation expectations in 2008-2009 were extremely low.
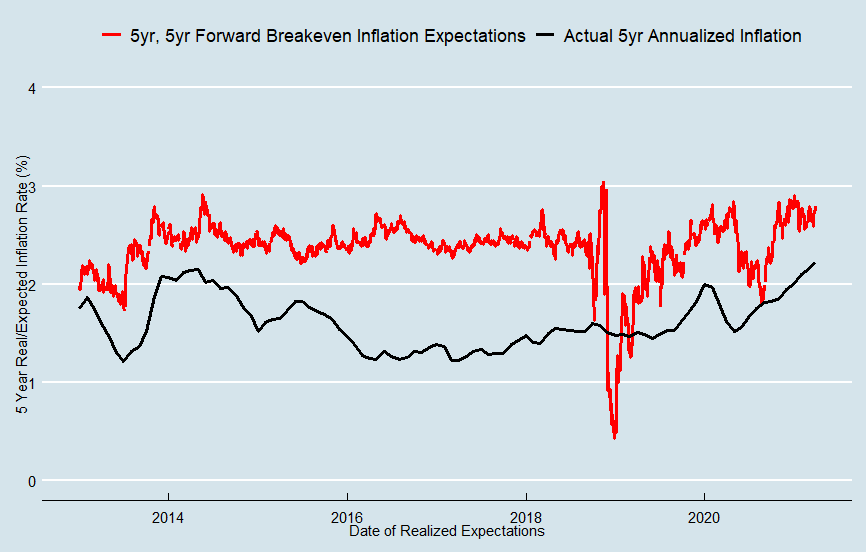
Using the 10-year and 5-year breakeven inflation rates, we can derive the 5-year, 5-year forward breakeven inflation rate. This is a little more complex, but it essentially represents inflation expectations for the 5-year period starting 5 years from now. So today’s 5-year, 5-year forward breakeven inflation rate represents the expected 5 year inflation from 2026-2031. In this graph, we can clearly see that the 5-year, 5 year forward breakeven inflation rate consistently dramatically overshoots actual inflation, aside from some volatile periods that represent expectations during the financial crisis. Why is this?
Sadly, TIPS breakeven inflation rates have endemic problems that make them inaccurate in measuring inflation expectations. To keep it short and simple, the breakeven inflation rate is determined mostly by inflation expectations but also partly by inflation and liquidity risk. The inflation risk premium embedded in non-inflation protected bonds leads the breakeven inflation rate to consistently overestimate inflation expectations, and the liquidity premium on TIPS can lead to the breakeven inflation rate dramatically underestimating inflation expectations during times of crisis.
Models
Luckily, models exist which incorporate the breakeven inflation rate with additional data in an attempt to correct for the inflation risk and liquidity risk premium and arrive at a better measure of inflation expectations. The two main models we will be discussing are the DKW (D’Amico, Kim, and Wei (2018)) model and the Federal Reserve Bank of Cleveland model. Now, it is important to acknowledge that both of these models may suffer from a degree of overfitting and back testing bias – that is, they were made with knowledge of the breakeven rate, actual inflation, and other data in the past and they have flaws in their design that may make them better at analyzing past data than future data. All data prior to 2013 and 2011 may be affected by these biases for the DKW and Cleveland Fed model, respectively.
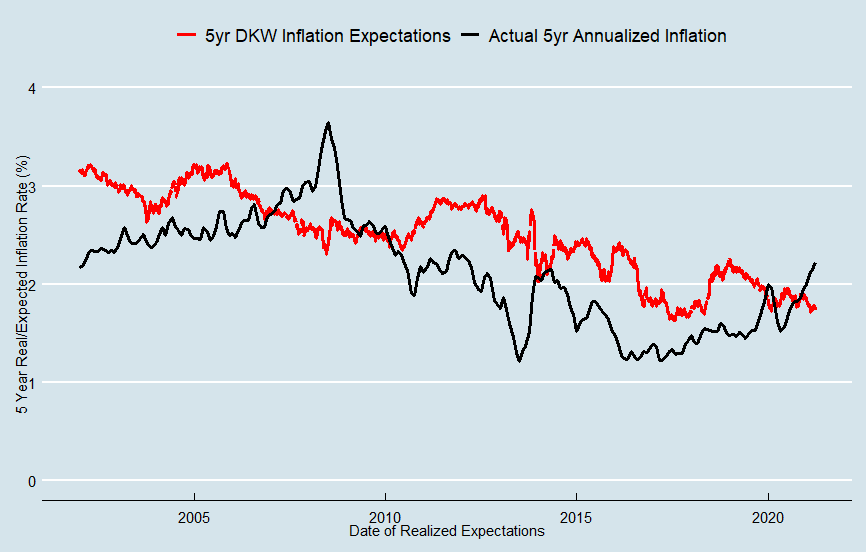
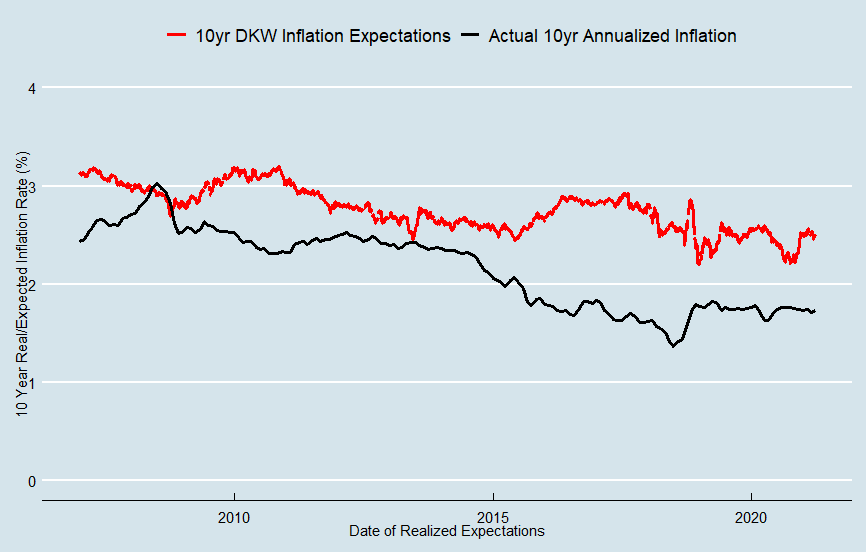
Here’s the DKW model estimation of 5-year inflation expectations versus the actual 5-year annualized inflation. The DKW model clearly corrects for the dramatic decline in the 5-year breakeven inflation rate during the global financial crisis (the y axis on the original graph of the 5-year breakeven inflation rate had to be extended to -3% to incorporate the data from 2009). However, the model’s measure of inflation expectations also consistently overshot real inflation for the periods ending between 2010 and 2018.
Graphing the DKW model’s estimation of 10-year inflation expectations against actual 10-year inflation makes it even clearer that the model’s measure of inflation expectation has consistently overshot inflation. A lot of this can again be chalked up to the financial crisis, a big theme in this blog, but expectations for the period ending in 2020 also significantly overshot realized inflation.
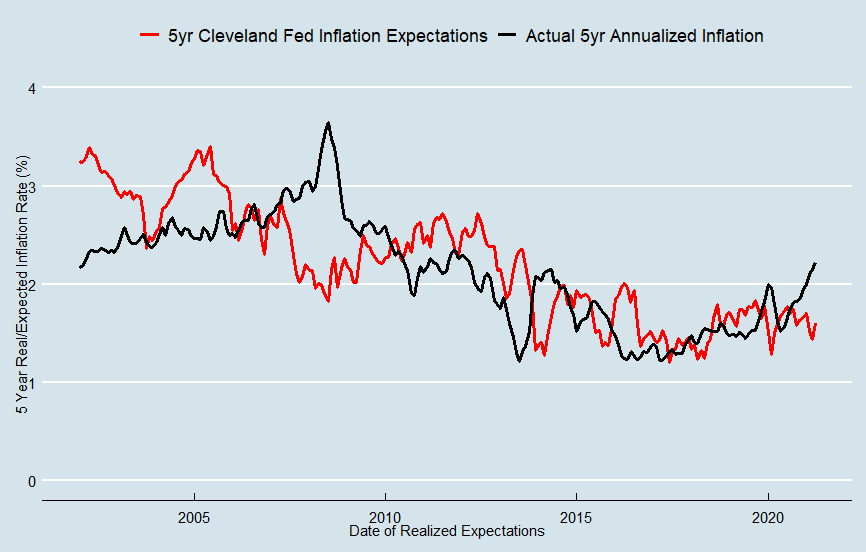
The Cleveland Fed’s model seems to fare a bit better in crafting a measure of inflation expectations that match actual inflation. The model both smooths over the noise created by liquidity shifts during the global financial crisis and quickly catches the drop in inflation expectations afterwards. The only significant deviation between the model and actual inflation is in the midst of the crisis, where real inflation actually overshot the model of expectations for the periods ending in 2008-2009.
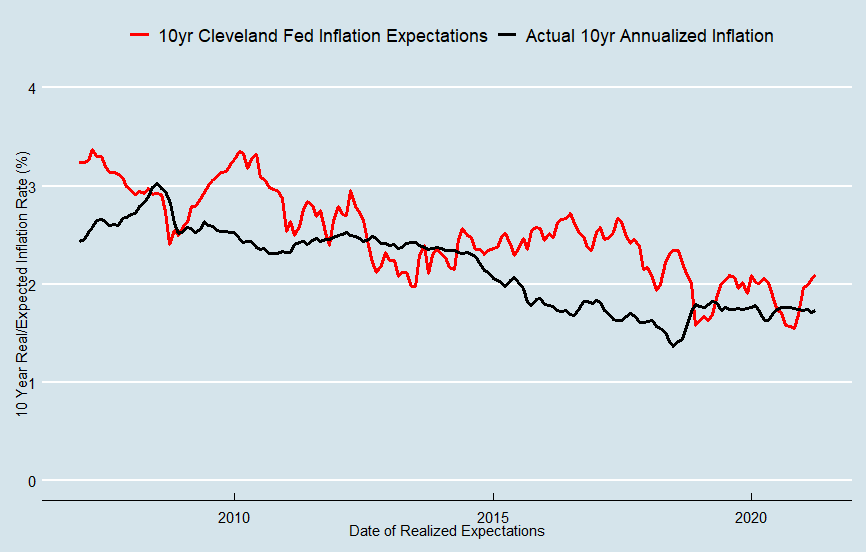
In analyzing the Cleveland Fed’s 10-year inflation expectations model, we can clearly see the gap caused by the global financial crisis. For the periods ending between 2015 and 2018, expectations ran significantly higher than realized inflation. However, the model’s expectations are still closer than either the TIPS alone or the DKW model. Post-financial crisis the model rapidly corrects so that expectations match realized inflation for the periods ending in 2019-2020. This is probably an ideal feature of a model like this – clearly, few were expecting the financial crisis in 2005, so having expectations exactly match realized inflation in 2008 would mean that the model’s measure of inflation expectations is overshooting true inflation expectations. After the GFC, inflation expectations fell significantly, and the model’s estimation of expectations dropped as well.
Surveys
Aside from using market-based measures of inflation expectations, we can examine survey-based measures of inflation expectations. The advantage of survey-based estimates is that you can directly poll the experts who study the economy and the consumers who participate in it, without having to rely on market-based measures that may contain non-inflation information in their prices. The three measures we will be looking at are the Livingston survey, the Survey of Professional Forecasters, and the University of Michigan consumer survey.
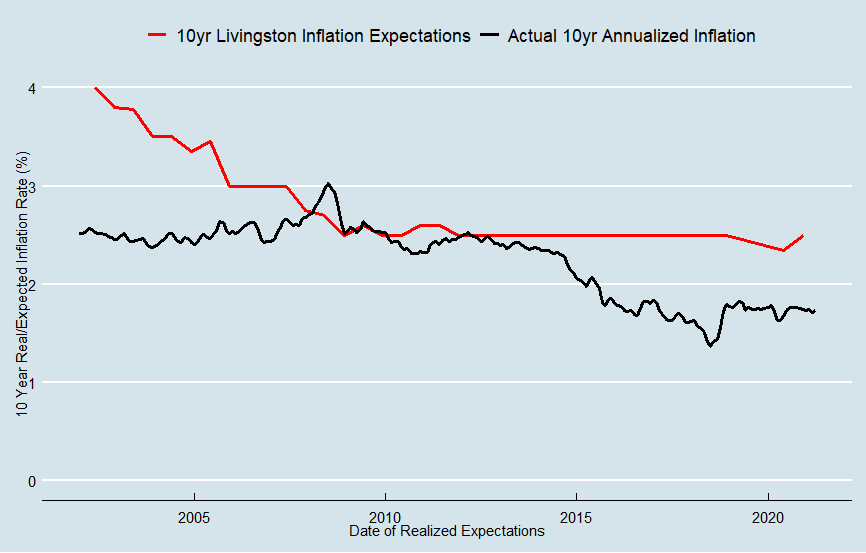
The Livingston survey “summarizes the forecasts of economists from industry, government, banking, and academia” to get a picture of expert expectations of inflation. Above is the median response from the Livingston survey’s question on 10-year inflation expectations plotted against the actual 10-year annualized inflation. Economists have generally underestimated long run inflation over the last two decades, particularly before the global financial crisis, and the median response has been stubbornly close to the 2.5% for the better part of a decade. Though there is a decrease in the wake of the financial crisis, it is hardly substantial and expectations increased to their pre-crisis baseline shortly after.
Professional forecasters fared little better than economists in general – their median expectations of inflation closely match the median from the Livingston survey, with some additional fluctuations. Again, forecasted inflation ended up much higher than realized inflation for the periods ending 2014-2020 partly because of the financial crisis.
Consumers have also tended to overestimate inflation over time, as seen in the University of Michigan survey of consumers. Median consumer inflation expectations seem extremely well anchored at 3%, only decreasing barely decreasing for the periods ending in 2019-2020.
The Aruoba Model, which combines the previously mentioned Survey of Professional Forecasters with the Blue Chip Economic Indicators and the Blue Chip Financial Forecasts, is a useful meta-model that combines different expert surveys to construct a more complete term structure of inflation expectations. The Aruoba model’s measures of 5-year inflation expectations have been extremely stable at around 2.3%, but have significantly overestimated inflation in the periods ending 2015-2020.
Analyzing the Aruoba model over 10 years makes the post financial crisis underestimation that much starker. However, it also highlights the high accuracy of the model for the periods ending from 2008-2014.
Aggregate Charts
For your convenience, I have aggregated the methods by category and expectation horizon to make it easier to compare all of the different expectations’ measurements. Please note that these graphs, unlike the ones before, contain measurements from prior to the creation of TIPS in 1997.
What are current expectations?
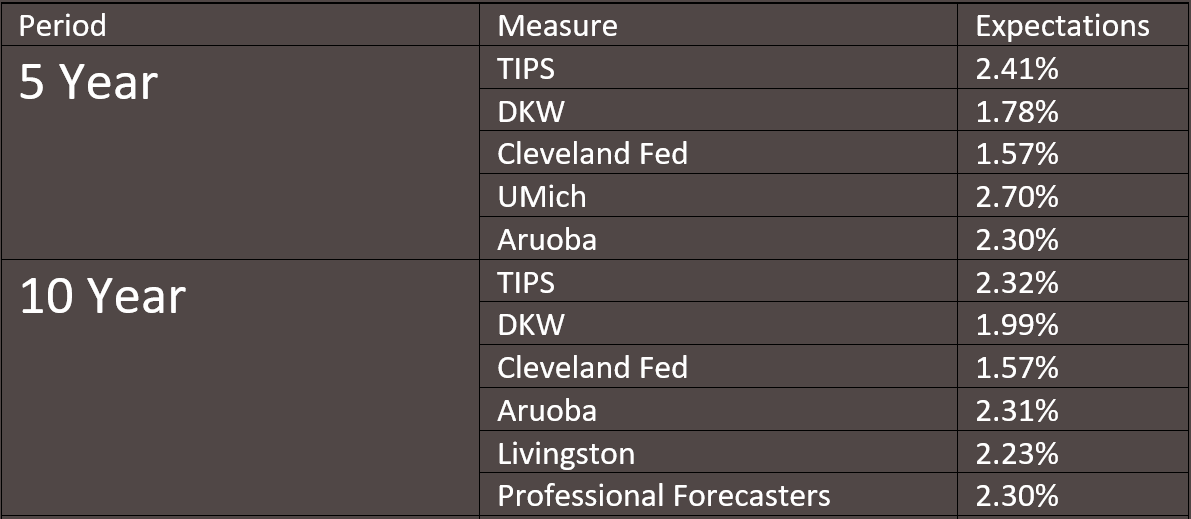
As of the time of writing, June 9th, 2021, the measures of inflation expectations are as follows:
Conclusions
Measuring inflation expectations is tricky business. It is worth noting that throughout this article I have compared different measures of inflation expectations to real inflation to determine their “accuracy”, but in truth this is a flawed premise. All models ignore some market participants, choose or analyze their data in imperfect ways, and fundamentally cannot examine the beliefs of every economic actor. Even if it was possible to construct a true measure of inflation expectations, it is likely that these measures would also consistently miss realized inflation as economic actors cannot predict many things that can dramatically affect inflation – pandemics, financial crisis, etc. It’s also worth noting that since inflation is a direct target of policy, and not a byproduct, it is much easier to forecast than other macroeconomic variables. If you had just consistently guessed “2%” for 5yr inflation over the last two decades, you would have been practically as accurate as the 5yr TIPS breakeven rate. Nevertheless, these measures of inflation expectations provide out best way of analyzing future inflation from our vantage point in the present.
Right now, inflation expectations remain extremely anchored around the 2% mark. When you consider that the Consumer Price Index, which virtually all of these measures of inflation expectations are based on, tends to outpaces the Federal Reserve’s preferred Personal Consumption Expenditures Price Index by about 0.3% annually over time, inflation expectations look even more muted. The Cleveland Fed model, which I personally believe is the most accurate, has both its 5- and 10-year measures of inflation expectations far below the 2% mark. Given the pandemic uncertainty, I do not think it is wise to expect the pre-pandemic level of accuracy from inflation expectations. Nevertheless, it remains clear that inflation expectations are not spiraling out of control and that the true risk is that inflation remains under target despite America’s expansionary monetary and fiscal policy.
To anyone who is worried about inflation I would ask “what if the Cleveland Fed model is right?”. What if, despite everything that has been done to bolster the economy during the pandemic, CPI from 2021-2026 averages a measly 1.5% and PCEPI clocks in at barely 1.2%? For inflation to remain below target would be a disaster for the economy – leaving NGDP growth sluggish, unemployment elevated, wage growth stagnant, and the long-term price stability in the US threatened. For just as high inflation threatens price stability, so does low inflation. Consumers, businesses, banks, and virtually all economic actors have planned multiyear contracts, loans, and projects around a 2% inflation rate that they believed was credible.
Or consider what this means for the Fed’s new framework. The Federal Reserve made a big show of the conversion to Flexible Average Inflation Targeting (FAIT), a topic that deserves its own blog post to fully explore. In short, the Fed now wants to see periods of above-2% inflation to compensate for periods of below-2% inflation in order to protect long term price stability and to ensure more appropriate policies for growth in wages and employment. FAIT is also a tacit acknowledgement that monetary policy was not expansionary enough in the post-2008 policy environment. What would it mean for FAIT’s credibility if the Federal Reserve was unable to induce inflation higher than 2% for any period of time post-pandemic and instead again rapidly tightened policy in response to perceived inflation risk?
Right now, the Federal Reserve should not let up their expansionary monetary policy. The threat of excess inflation remains minimal – and the threat of increased unemployment and low economic growth remains high. The federal government should continue to undertake the borrowing and spending necessary to protect Americans and their economic futures from the virus with the knowledge that deflation remains the primary threat to America’s long-term economic health.
——————————————————————————————————————
I also have to give credit to the YouTuber “Star Path Academy” who came up with an extremely similar title “What to expect when expecting high inflation” for his YouTube video here. While I disagree vehemently with his predictions for inflation in the United States, his personal stories about hyperinflation in Romania are extremely interesting and I encourage you to give him a watch.








When does deficit spending and monetary inflation become a problem exactly? And I mean exactly when. With all of these charts and stats you should be able to inform us on exactly when it will mathematically become an issue. Also, why wouldn’t inflation be a problem in this situation? The middle-lower class people the fed and congress are trying to help are now paying that stimulus back with higher oil, electricity, and good prices.